Door categorieën bladeren
Ontdekken
Fiverr Pro
Nederlands
$
USD

Automatische vertaling
Heb je data die niemand begrijpt
omdat het vastzit in een spreadsheet?
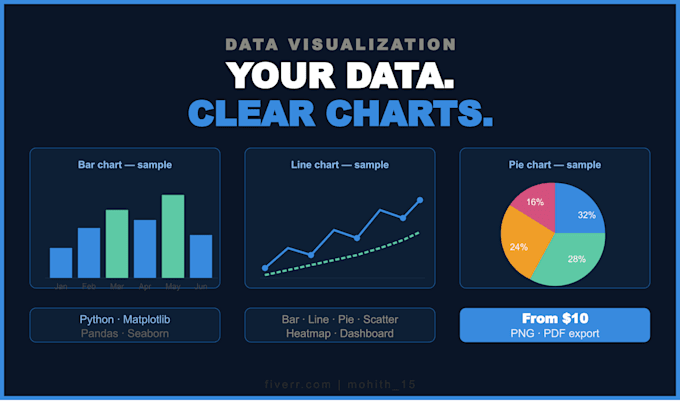
Ik zet je ruwe data om in schone,
professionele grafieken met Python Matplotlib
klaar voor rapporten, presentaties of
zakelijke beslissingen.
Wat ik voor je maak:
- Staafdiagrammen, lijndiagrammen, scatterplots
- Taartdiagrammen, histogrammen, heatmaps
- Multi-paneel dashboards (subplots)
- Tijdreeksen en trendgrafieken
- Geannoteerde grafieken met labels en inzichten
- Export in hoge resolutie PNG of PDF
Tools: Python, Matplotlib, Pandas, Seaborn
Waarom Python Matplotlib boven Power BI?
Geen licentie nodig. Volledige controle over
kleuren, lettertypes en lay-out. Perfect voor
maatwerk en publicatieklare visuals.
Voor wie is dit?
Studenten, onderzoekers, kleine bedrijven,
of iedereen die snel professionele charts nodig heeft zonder technische kennis.
Weet je niet welk charttype bij je data past?
Stuur me eerst een bericht, ik adviseer je gratis!
Data Scientist Python Machine Learning AI Solutions
Talen
Automatische vertaling
