Door categorieën bladeren
Ontdekken
Fiverr Pro
Nederlands
$
USD
Software Engineer
Hi There!
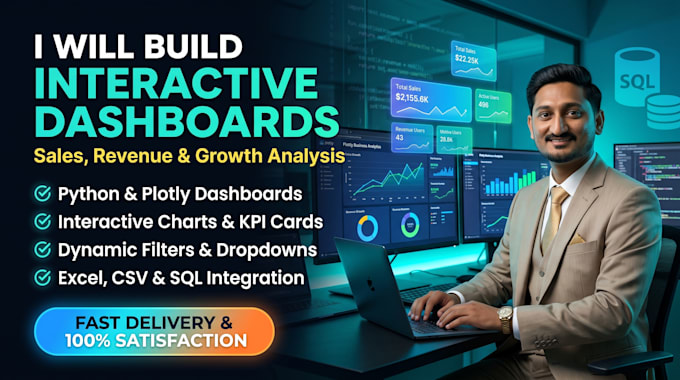
Are you looking for interactive business analytics dashboard using Python and Plotly? You are in the right place. I can build custom dashboard to help you understand your business data, track KPIs, and view important information in clear format. I can create interactive charts, summary cards, filters and data visualizations according to your project requirements
Analytics Dashboard Gig Features:
Interactive Business Analytics Dashboards
Python Dashboard Development
Plotly Charts and Graphs
Sales and Revenue Analysis
KPI Tracking and Reporting
Data Cleaning with Pandas
Excel and CSV Data Analysis
Interactive Data Visualization
Dynamic Filters and Dropdowns
Business Performance Monitoring
Dashboard Layout and Design
Why Purchase This Gig?
Clean and Professional Design
Easy-to-Understand Visual Reports
Interactive Charts and Filters
Business-Focused Visualization
User-Friendly Dashboard
My goal is to make your business data easier to understand and more useful for daily decisions. If you need sales dashboard, revenue report, KPI tracker, or custom business analytics dashboard, I can help.
Related Tags:
#Python #Plotly #Dashboards #BusinessAnalytics



Can you build custom Python dashboard?
Yes, I can create dashboard based on your data, KPIs, and business requirements.
Which data formats do you support?
I can work with Excel, CSV, Google Sheets, or SQL data, depending on access and project scope.
Can you create interactive Plotly charts?
Yes, I can create interactive bar, line, pie, scatter and heatmap charts.
Can you add KPI cards and filters?
I can can include KPI summary cards, dropdowns and interactive filters.