I will create qlik sales and operations dashboard for executives

A
ab_rehman2
A
ab_rehman2
Abdul Rehman
Sommige informatie wordt in het Engels weergegeven.

Over deze dienst

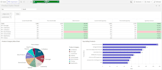
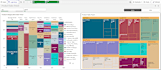
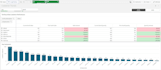
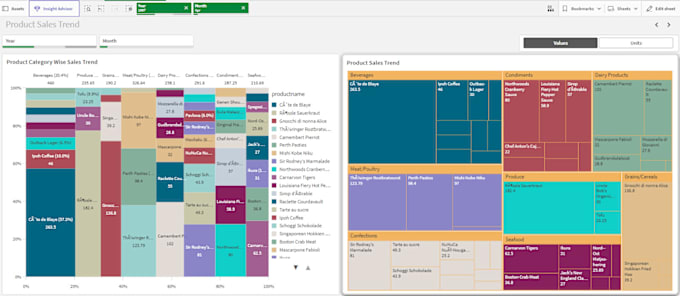
I can create all types of visualization available in Qlik Sense,

  • I can create Line Chart, Pie Chart, Area Chart, Scatter Plot, Histogram, Heatmap, Bubble Chart, Waterfall Chart, Box Plot, Donut Chart.
  • I can create dashboards with multiple resources which would update data on daily basis as the source is updated
  • I can create reports with complex calculations
  • I can write scripts to load data from multiple sources, joining them and maintaining the data model

Drop me a message before ordering so we can discuss your requirements,

Let Data Determine your Future.

Maak kennis met Abdul Rehman

Abdul Rehman

The Dashboard Guy

5,0(1)
  • Afkomstig uitPakistan
  • Lid sindsmrt 2023
  • Laatste levering7 maanden
  • Talen

    Urdu, Engels, Duits, Spaans
Turn your data into decisions. I’m a Data Engineer & BI Developer with 3 years of industry experience helping companies unlock insights from complex data. I design star‑schema models, build optimized ETL pipelines, and deliver interactive dashboards in Qlik Sense & Power BI. Skilled in SQL, data warehousing, and analytics, I focus on performance, KPIs, and clear storytelling—so your dashboards don’t just look good, they drive smarter strategies and measurable impact.

Mijn portfolio