Door categorieën bladeren
Ontdekken
Fiverr Pro
Nederlands
$
USD


_b3tv8t.jpg)
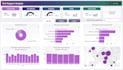
Still making business decisions by scrolling
through raw Excel files?
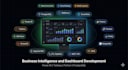
I build interactive dashboards and BI solutions
that turn your messy data into clear, actionable
insights using Power BI, Tableau, or custom
Python dashboards.
BI AND VISUALIZATION TOOLS
Power BI, Tableau, QlikView
Python (Matplotlib, Plotly, Dash, Streamlit)
DATA SOURCES I WORK WITH
Excel, CSV, SQL databases, PostgreSQL,
Google Sheets, REST APIs, BigQuery, Snowflake
DATA PROCESSING
Python (pandas, NumPy), SQL, Apache NiFi,
ETL pipelines, automated data refresh
CLOUD PLATFORMS
AWS, Google Cloud, Azure
What you get with every order:
Clean interactive dashboard with filters
KPI cards and performance metrics
Charts, graphs, trend lines and heat maps
Multi-source data integration
Mobile responsive layout
Source files and documentation
Industry dashboards I have built:
Retail sales and inventory analytics
HR attendance and payroll reporting
Student performance and fee tracking
Gym membership and revenue insights
GST compliance and tax reporting
These are not sample projects. These are
live dashboards running in real businesses.
Who this is for:
Business owners who want real-time insights
Talen


