Door categorieën bladeren
Ontdekken
Fiverr Pro
Nederlands
$
USD

Automatische vertaling
Heb je een schoon en interactief dashboard nodig van je data?
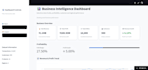
Ik zet je Excel- of CSV-data om in een duidelijk, gemakkelijk te begrijpen dashboard met Python en Streamlit.
Wat ik kan bieden:
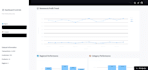
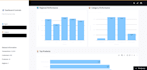
Interactieve grafieken en visualisaties
KPI-kaarten en belangrijke statistieken
Filters voor eenvoudige data-analyse
Straal en professioneel dashboardontwerp
Basis data cleaning en voorbereiding
Nuttige inzichten uit je data
Waarom met mij werken?
Duidelijke communicatie
Straal en praktische resultaten
Revisies op basis van jouw wensen
Prijs voor studenten
Stuur me gerust een bericht voordat je bestelt als je specifieke wensen hebt of een aangepaste dataset.
Python and Data Analytics, Streamlit Dashboard Developer
Talen
Automatische vertaling
Automatische vertaling
Met welke dataformaten kun je werken?
Ik kan werken met Excel, CSV, Google Sheets of data uit de meeste gangbare databases. Als je data in een ander formaat hebt, stuur me dan een bericht voordat je bestelt en ik bevestig het.
Moet ik al schone, georganiseerde data hebben?
Niet per se. Ik kan basis schoonmaak en structurering doen als onderdeel van het proces — deel gewoon wat je hebt, en ik laat je weten of er vooraf nog grote schoonmaak nodig is.
Welke tools gebruik je om het dashboard te bouwen?
Afhankelijk van je wensen gebruik ik Power BI, Excel of Python (Pandas, Plotly, Streamlit) om dashboards te bouwen die interactief, visueel en makkelijk te begrijpen zijn.
Kan ik het dashboard later zelf bijwerken?
Ja — ik ontwerp dashboards zodat jij (of je team) de data makkelijk kunt verversen zonder iets opnieuw te hoeven bouwen, en ik voeg basis instructies toe.
Hoeveel revisies krijg ik?
Revisies hangen af van het pakket dat je kiest (zie pakketdetails), maar ik zorg er altijd voor dat het uiteindelijke dashboard aansluit bij wat je echt nodig hebt voor levering.
Kan ik een op maat gemaakt pakket aanvragen buiten de genoemde tiers?
Absoluut — stuur me een bericht met je wensen en ik stel een op maat gemaakt aanbod samen dat past bij jouw data en budget.


