I will create rstudio data visualization with ggplot2

Sommige informatie wordt in het Engels weergegeven.

Kenia

Ik spreek Engels

R Expert Mojo

I am a skilled Statistical Data Analyst and Business Intelligence Specialist with expertise in data analysis, visualization, and machine learning. I specialize in transforming raw data into actionable...
Over deze dienst

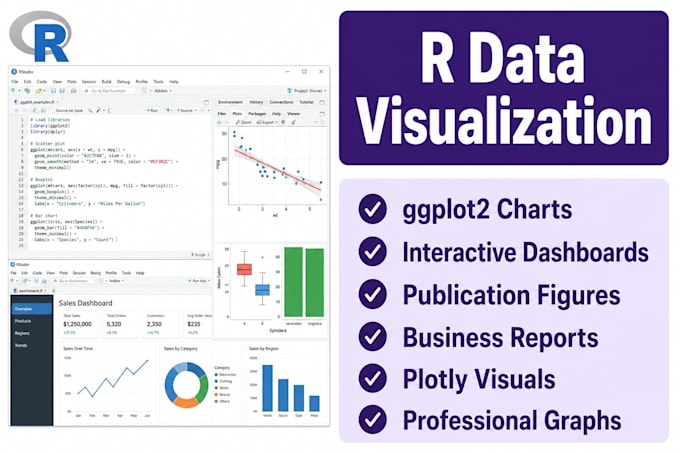
Hello, I'll help you with R programming, ggplot2, RStudio & professional data visualization. I'll help create insightful, quality charts, dashboards and analytical graphics.


Services

  • ggplot2 Charts
  • Data Visualization
  • Interactive Charts
  • Plotly
  • Dashboards
  • Flexdashboard
  • Business Reports
  • Publication Figures
  • Statistical Graphics
  • Heatmaps
  • Scatterplots
  • Boxplots
  • Histograms
  • Time Series Graphs
  • Custom Themes
  • Data Storytelling
  • Presentation Graphics


Why Work With Me

  • Beautiful visualizations
  • Clean code
  • Publication-ready figures
  • Custom color themes
  • Interactive dashboards
  • Business-quality reports
  • Fast turnaround
  • Professional communication


Please message me before placing your order so we can discuss your visualization requirements and choose the best package.

Programmeertaal:

Python

R

SPSS

Technologie:

Excel

Google Sheets

Jupyter-notitieboek

MATLAB

Type analyse:

Kwantitatieve analyse

statistische analyse

Expertise:

Zakelijke inzichten

Algoritmes

Forecasting

Tools:

Jamovi

RStudio

Stata

Google Colab

Microsoft Excel