Ik bouw interactieve data dashboards en web apps in r shiny

A
arifgecen
A
arifgecen
Arif G
Sommige informatie is automatisch vertaald.

Over deze dienst

Automatische vertaling

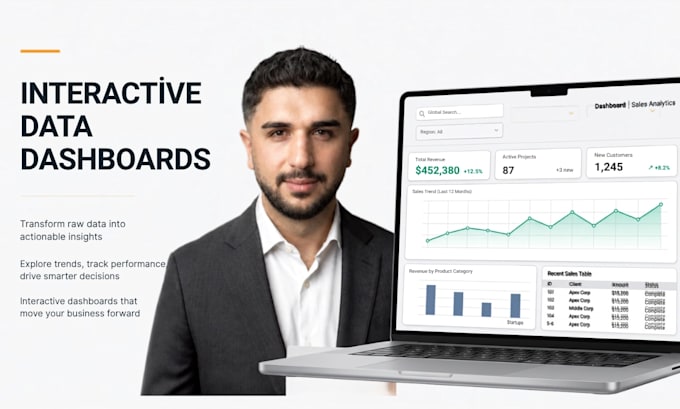
Transformeer je statische spreadsheets in snelle, interactieve en responsieve web dashboards.

Ik maak aangepaste data dashboards met R Shiny en Python Streamlit, zodat stakeholders eenvoudig live data kunnen filteren, verkennen en visualiseren.

Wat ik bouw:

  • Dynamische KPI-kaarten en samenvattingswidgets
  • Interactieve Plotly, Leaflet en ggplot grafieken
  • Gebruikersinvoerscontrols: datumbereikselectors, dropdowns, schuifregelaars, CSV/Excel uploaders
  • Geautomatiseerde exporttools om gefilterde datasets en grafieken te downloaden in PDF of Excel
  • Gratis cloud deployment naar shinyapps.io of Streamlit Community Cloud

Leveringen:

  • Compleet, gestructureerd broncode (ui.R / server.R of app.py)
  • Setup documentatie om lokaal te draaien of data bij te werken
  • Live weblink indien deployment is inbegrepen

Stuur me een bericht met je lay-out voorkeuren of een ruwe schets om te beginnen.

Maak kennis met Arif G

Arif G
  • Afkomstig uitTurkije
  • Lid sindsjun 2023
  • Gem. reactietijd1 uur
  • Talen

    Engels, Spaans, Duits
Hi there! I am a professional Statistician and Data Analyst with a solid mathematical background and extensive hands-on experience in R, Python, SPSS, and SQL. I specialize in transforming complex data into actionable insights, rigorous academic reports, and high-performance predictive models. Whether you need hypothesis testing, predictive machine learning pipelines, custom R Shiny dashboards, or data cleaning, I deliver clean code and clear visual interpretations.

Automatische vertaling