Het lijkt erop dat deze dienst tijdelijk niet beschikbaar is

Ik maak interactieve Excel-dashboards met grafieken en KPI's

A
ashpakt
A
ashpakt
Ashpak
Sommige informatie is automatisch vertaald.

Over deze dienst

Automatische vertaling

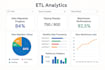
Wil je je data omzetten in bruikbare visuals?

Ik ontwerp een maatwerk Excel dashboard met grafieken, KPI's, filters en een overzichtelijke opmaak zodat je data makkelijk te begrijpen en te presenteren is.

Perfect voor:

  • Zakelijke rapporten
  • Verkoop- en marketingdashboards
  • Financiële samenvattingen
  • Projecttracking

Wat ik aanbied:

  • Pivottabellen & grafieken
  • Slicers, dropdowns, filters
  • KPI-indicatoren
  • Data transformatie
  • Voorwaardelijke opmaak
  • Automatisering met VBA (Premium)

100% vertrouwelijkheid | Snelle communicatie | Hoge kwaliteit gegarandeerd

Maak kennis met Ashpak

Ashpak

Excel Expert ! Data Analysis ! Dashboards ! Automation ! Reporting

  • Afkomstig uitIndia
  • Lid sindsdec 2024
  • Talen

    Engels, Hindi, Kannada, Marathi
I will do Excel Data Cleaning accurately and will deliver the ask on time. Hi! I'm an Excel Specialist with over 10+ years of experience in data analysis, reporting, automation, and dashboard creation.I help businesses and professionals turn raw data into actionable insights using advanced Excel features including: Pivot Tables & VLOOKUP/XLOOKUP Dashboards with Charts & Conditional Formatting VBA & Macro Automation Data Cleaning & Formatting Excel to Power BI migration CSV, Google Sheets & API-based data import/export Whether you're a startup, SME, corporate team, I can help to simplify data

Automatische vertaling