Door categorieën bladeren
Ontdekken
Fiverr Pro
Nederlands
$
USD
Turning Data into Dashboards, Reports and Automated Insights
Niveau 2
Voldoet aan hoge prestatiecriteria en heeft een bewezen staat van dienst in het voldoen aan de verwachtingen van de klant.
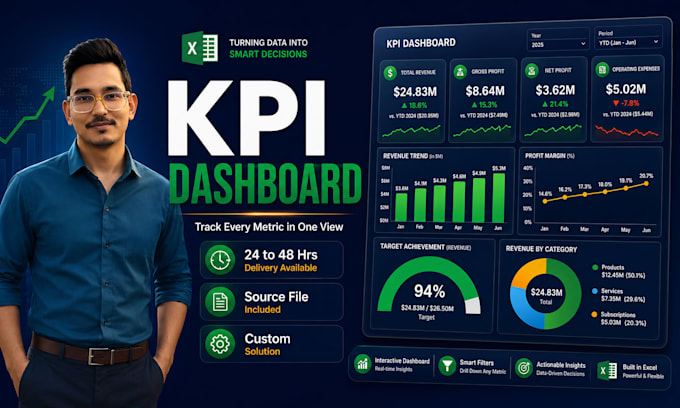
See every KPI in one clean, interactive view and know exactly what is on or off target.
Hunting for numbers across sheets wastes time and hides problems. I build interactive KPI dashboards that bring your targets, actuals, trends and alerts into one executive cockpit.
You receive: KPI tiles with targets and variance, trend charts, conditional-format alerts, dynamic filters and an editable source file. Automated workflows let you refresh in one click.
Benefits: actionable insights at a glance, professional design, and scalable solutions you can filter by team, region or period built for real executive reporting. Each metric is calculated correctly and laid out for fast scanning, so weekly reporting takes minutes instead of hours and nothing important slips through.
Why this service: 24 to 48 hrs delivery available, fast communication, clean professional design, documentation included and post-delivery support.
Message me your KPIs and targets before ordering and I will structure the best dashboard for your business.


Technologie:
Excel
•
Google Sheets
•
Microsoft Word
•
Power BI
•
SQL
Datatype:
Numeriek
•
Reeks
•
datum
•
Op maat
•
Valuta
Which KPIs can you build?
Any business, sales, finance, marketing or operations KPIs. Tell me your metrics and targets and I structure them with the right calculations.
Can it show targets versus actuals?
Yes, each tile shows actual, target and variance with conditional-format alerts so off-target metrics stand out instantly.
Will it update with new data?
Yes, on Pro and Command I set up a one-click Power Query refresh.
Can I filter by team, region or month?
Yes, dynamic slicers let anyone drill down without touching formulas.
What do you need to start?
Your data export and your KPI list with targets. A quick message before ordering confirms scope.
How fast is delivery?
1–7 days by package.
Do I get the editable file?
Yes, always, so your team can maintain and extend the dashboard.
Can you match our branding?
Yes, colours, logo and layout to match your company style.
Is post-delivery support included?
Yes, support plus documentation so the dashboard is easy to run.
Can you add forecasting or targets logic?
Yes, target-setting and simple forecasting can be added as an extra or on Command.