Door categorieën bladeren
Ontdekken
Fiverr Pro
Nederlands
$
USD


Automatische vertaling
Wil je dat je data wordt omgezet in een dashboard dat echt een verhaal vertelt?
Ik maak overzichtelijke, interactieve Tableau dashboards om trends te ontdekken, prestaties te vergelijken en snel inzicht te krijgen in je data.
Wat ik heb gemaakt:
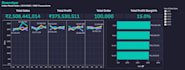
Een 4-pagina dashboard dat meer dan 1.00.000 retailtransacties analyseert in 10 Indiase staten — met inzicht in stadsprestaties, outlet-prestaties en de impact van kortingen, allemaal met aangepaste filters en een dark theme UI.
Let op: Ik gebruik Tableau Public, dus de levering is een downloadbare workbook (.twbx) die geopend kan worden met de gratis Tableau Reader/Public Desktop. Jouw data blijft privé. Het is het meest geschikt voor portfolio, academische of demo data — niet voor zeer gevoelige live bedrijfsdata.
Stuur je data en wat je wilt tracken — laten we beginnen.
Excel, Tableau and SQL Analyst, Dashboards That Drive Decisions
Talen
Automatische vertaling


