Door categorieën bladeren
Ontdekken
Fiverr Pro
Nederlands
$
USD

Automatische vertaling
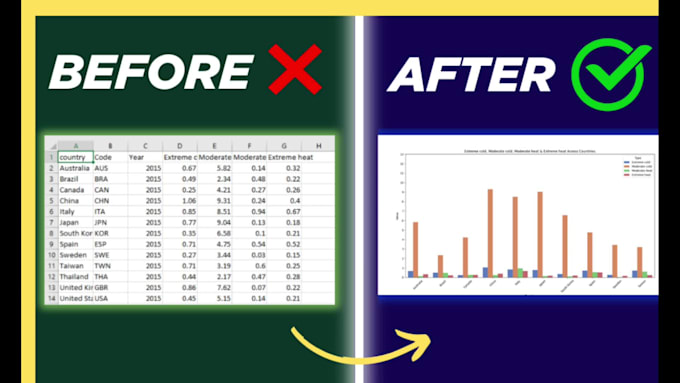
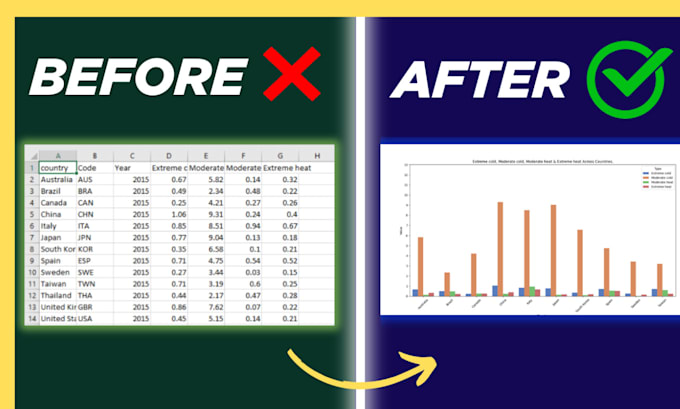
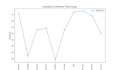
Als je op zoek bent naar gepersonaliseerde data visualisatie grafieken/diagrammen, ben je hier aan het juiste adres.
Ik ben hier om voor jou lijngrafieken en staafdiagrammen te maken. Ik zal infographics en vergelijkingsdiagrammen van jouw data creëren. Ik ben jouw data visualisatie expert met Python.
WAAROM IK JOU DE BESTE KEUZE BEN?
Gebruik van infographics & vergelijkingsgrafieken:
Dat gezegd hebbende, verzeker ik je dat ik de beste vergelijking of variatie bar charts of lijngrafieken maak, omdat het de moeite waard is en je jouw bedrijf kunt uitbreiden.
Mijn vereiste:
Keywords: ontwikkel lijngrafieken, infographics, staafdiagrammen, vergelijkingsgrafieken, lijngrafieken.
Website Developer and Data Analyst
Talen
Automatische vertaling
Automatische vertaling
Zijn er extra kosten voor de broncode?
Nee, dat is gratis.
In welke taal komt de broncode?
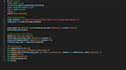
Het wordt in Python geschreven.
Welke tool gebruik ik voor het plotten van grafieken/diagrammen?
Ik kan verschillende libraries in Python gebruiken, waaronder Pandas, seaborn, matplotlib en numpy.
Kan ik het thema van de grafiek aanpassen?
Ja, je kunt me elk thema vertellen, aangezien Seaborn vijf verschillende thema's heeft: (1) "darkgrid", (2) "whitegrid", (3) "dark", (4) "white", en (5) "ticks"
| (1) | ||
| (0) | ||
| (0) | ||
| (0) | ||
| (0) |

bouz11

Marokko
The delivered high-quality work exactly as promised—and even ahead of schedule. Communication was smooth and professional throughout the project. They understood my requirements perfectly and went above and beyond to ensure I was happy with the final result. Highly recommend and will definitely work with them again in the future!
US$ 50-US$ 100
Prijs
6 weken geleden
Looptijd

Reactie van de freelancer
| (1) | ||
| (0) | ||
| (0) | ||
| (0) | ||
| (0) |
bouz11
Marokko
The delivered high-quality work exactly as promised—and even ahead of schedule. Communication was smooth and professional throughout the project. They understood my requirements perfectly and went above and beyond to ensure I was happy with the final result. Highly recommend and will definitely work with them again in the future!
US$ 50-US$ 100
Prijs
6 weken geleden
Looptijd
Reactie van de freelancer