Sommige informatie wordt in het Engels weergegeven.
Over mij
I turn raw research data into publication-ready charts.
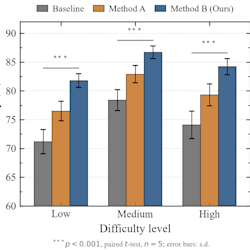
I draw line, bar, scatter and box plots with error bands, heatmaps, confusion matrices, multi-panel figures with (a)(b)(c) labels, flowcharts and model diagrams.
You get 300 dpi PNG, vector PDF or SVG, the source file, and 3 rounds of revisions. Single charts usually ship within 24 hours.
I keep colours, fonts and line weights consistent across all figures, and I never change your data.
Send me your data or a sketch - I will tell you free if it can be drawn.... Lees meer