Het lijkt erop dat deze dienst tijdelijk niet beschikbaar is

I will create eye catching dashboard visualizations using bi tools

C
creator_im
C
creator_im
creator_im
Sommige informatie wordt in het Engels weergegeven.

Over deze dienst

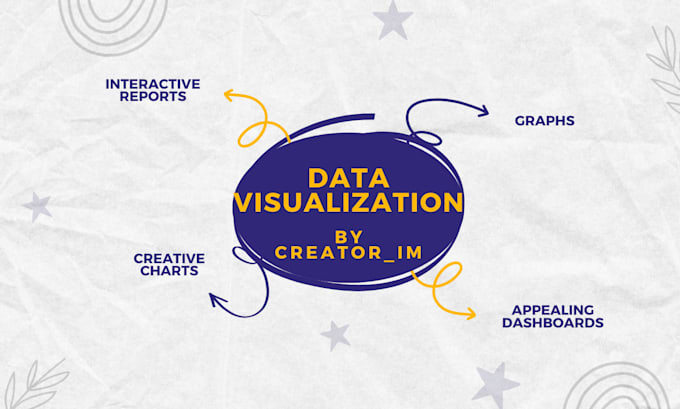
I'm here to deliver interactive Data Visualizations using Excel, Tableau or Power BI.

I have the ability to translate complex data into meaningful graphs and reports that can be used to gain inferable insights or to be presented to the stakeholders.

I am passionate about data analysis and proficient in working with BI tools with excellent knowledge of SQL.


What can you expect from this Gig:


  1. Informative Dashboards and Reports
  2. Data pull and transformation from various data sources such as Excel, Pdf, CSV, Sql, Mysql
  3. Appealing Visuals using DAX functions
  4. Interactive Graphs and Charts including Bar, Pie, Histograms and much more.
  5. Professional reports including filters to make them user-interactive
  6. On-time Delivery


Please contact me before placing an order!

Maak kennis met creator_im

creator_im
  • Afkomstig uitVerenigde Staten
  • Lid sindsmei 2022
  • Talen

    Hindi, Engels
I am a 5+ years experienced IT professional and a Content Writer. I have worked in BI Analysis with Tableau and Power BI to create detailed and attractive data visualizations using different data sources. I have an extensive work experience in writing complex SQL queries and Python code. I also do ghostwriting and have been working as a freelancer to write LinkedIn Blogs, Profiles, Magazine articles, Press Releases etc. I also create briefing docs and questionnaires for media interviews of well known personalities. I am self-motivated and eager to deliver outstanding results to the clients.