Door categorieën bladeren
Ontdekken
Fiverr Pro
Nederlands
$
USD

Automatische vertaling
Heb je een dashboard dat echt zin heeft nodig?
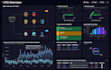
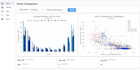
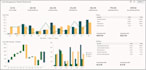
Ik maak voor jou een strak, interactief webapp met behulp van Plotly Dash of Streamlit die je data omzet in beslissingen. Of je nu investeerders wilt overtuigen, KPI's wilt bijhouden, of gewoon moe bent van het staren naar spreadsheets. Ik ontwerp iets dat er scherp uitziet en er op maat gemaakt uitziet.
ZO GA IK TE WERK :
Voor je bestelt:
Dashboards that actually make sense!
Talen
Automatische vertaling
Automatische vertaling
Wat heb je van mij nodig om te beginnen?
Jouw dataset (CSV, Excel of API), een korte briefing over wat je wilt zien, en eventuele ontwerpvoorkeuren. Dat is alles. We starten met een korte meeting om verwachtingen af te stemmen, je doelen te verduidelijken en te zorgen dat je data begrepen wordt voordat ik begin.
Kun je verbinden met live data of APIs?
Ja. Premium omvat volledige API/data bron integratie. Je kunt het ook als extra toevoegen aan elk pakket.
Wordt mijn dashboard online gehost?
Absoluut. Ik kan het deployen naar Streamlit Cloud, Render of AWS. We bespreken de beste optie tijdens de kickoff.
Kan ik na levering nog wijzigingen aanvragen?
Natuurlijk. Elk pakket bevat revisies. Premium komt met onbeperkte tweaks totdat het perfect is.
Kun je een NDA ondertekenen?
Ja. Ik respecteer je privacy en onderteken graag NDA's voordat we beginnen.
Bied je mobiele dashboards aan?
Ja, responsive layouts zijn op aanvraag beschikbaar en inbegrepen bij Premium.
Wat als je vragen hebt tijdens het project?
Als iets onduidelijk is of ik je input nodig heb, neem ik contact op voordat ik grote beslissingen of wijzigingen doorvoer. Ik geloof in samenwerking, dus je bent altijd op de hoogte wanneer het er toe doet.


