Door categorieën bladeren
Ontdekken
Fiverr Pro
Nederlands
$
USD

Automatische vertaling
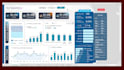
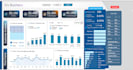
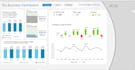
Ik maak een professionele, interactieve Sales & Profitability Dashboard (Power BI of Excel) die rommelige sales data omzet in duidelijke, bruikbare inzichten.
Wat ik lever:
Schoon dataset + datamodel (Power BI / Excel)
KPI-tegels (Omzet, Doel, COGS, winstmarge, variatie %)
Tijdlijn overzicht (Omzet per maand/kwartaal, MoM verandering, dag/weekend grafieken)
Winkel / Product overzicht (Omzet vs doel per winkel, topproducten, retourpercentages)
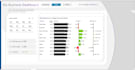
Winstgevendheid overzicht (COGS, terugbetalingen, winstmarge per product/klant)
Interactieve filters & slicers (Datum, Winkel, Productcategorie, Regio)
PDF-snapshot rapport + 1-pagina gebruikersgids
Waarom voor mij kiezen: 6+ jaar ervaring met complexe operationele data, expert in Power BI & Excel, snelle communicatie, en levering met aanpassingen totdat je tevreden bent.
Leveringen: .pbix of .xlsx, PDF-rapport, bewerkbare bron, en een 1-pagina gids.
Talen
Automatische vertaling
Automatische vertaling
Q1: Welke data heb ik nodig om te starten?
A: Ik heb je ruwe sales data nodig (Excel of CSV), een lijst met KPI's die je wilt volgen (bijvoorbeeld totale omzet, doel, winst, COGS, retouren), en eventuele voorkeur voor tijdsperiode of regio filter. Als je een voorbeeld dashboard of rapportformat hebt, helpt het om dat te delen zodat ik sneller kan ontwerpen.
Q2: Kun je mijn data schoonmaken en voorbereiden voordat je het dashboard bouwt?
A: Absoluut! Data schoonmaken en organiseren zit in alle pakketten inbegrepen. Ik verwijder dubbele gegevens, verwerk ontbrekende waarden en structureer je data voor nauwkeurige berekeningen voordat ik het visualiseer.
Q3: Welke tools gebruik je om dashboards te maken?
A: Ik gebruik vooral Power BI en Microsoft Excel. Afhankelijk van je voorkeur en de complexiteit van de data, adviseer ik de beste tool voor jouw situatie — beide zijn professionele opties.
Q4: Blijft mijn data vertrouwelijk en veilig?
A: 100%. Ik deel of hergebruik geen klantgegevens. Je bestanden worden vertrouwelijk behandeld en verwijderd zodra het project klaar is.


