Door categorieën bladeren
Ontdekken
Fiverr Pro
Nederlands
$
USD


Automatische vertaling
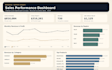
Zet je Excel- of CSV-gegevens om in een duidelijk en professioneel zakelijk dashboard.
Ik maak een interactief Excel-dashboard dat je helpt bij het monitoren van KPI's, het herkennen van trends en het begrijpen van de bedrijfsresultaten.
Ik kan helpen met:
Data schoonmaken en organiseren
Excel-formules
PivotTables en PivotCharts
Power Query in Excel
KPI-berekeningen
Interactieve filters en slicers
Verkoop- en omzetdashboards
Klant- en productanalyse
Maand- en jaarvergelijkingen
Managementrapportages
Jouw dashboard wordt opgebouwd rondom jouw bedrijfsvragen.
Mijn doel is niet alleen om grafieken te maken. Ik creëer praktische Excel-rapporten die je data makkelijker te begrijpen en te gebruiken maken.
Neem contact met me op voordat je grote of complexe projecten bestelt.
Business Intelligence Power BI Excel SQL Data Analysis
Talen
Automatische vertaling
Automatische vertaling
Moet ik contact met u opnemen voordat ik een bestelling plaats?
Voor grote bestanden, complexe formules, meerdere sheets, geavanceerd Power Query werk of bestaande dashboards die grote wijzigingen nodig hebben, neem eerst contact met me op zodat ik het juiste pakket kan bevestigen.
Biedt u aangepaste bestellingen aan?
Ja. Als je Excel-project buiten de standaard pakketten valt, kan ik een aangepaste offerte maken op basis van het aantal bestanden, dashboards, KPI's, formules en complexiteit.
Kun je rommelige Excel- of CSV-gegevens schoonmaken?
Ja. Ik kan duplicaten, inconsistente formaten, datums, categorieën, tekst, nummers, lege velden en andere veelvoorkomende datakwaliteitsproblemen schoonmaken, afhankelijk van het gekozen pakket.
Kan je interactieve Excel dashboards maken?
Ja. Dashboards kunnen PivotTables, PivotCharts, slicers, filters, KPI-kaarten, formules en Power Query bevatten waar nodig.
Kun je aangepaste KPI's en formules maken?
Ja. Als de benodigde data beschikbaar is, kan ik aangepaste KPI-berekeningen en Excel-formules maken op basis van jouw bedrijfsbehoeften.
Kun je een bestaand Excel-werkboek of dashboard verbeteren?
Ja. Ik kan bestaande Excel-dashboards en rapportage-werkboeken beoordelen, herstructureren, vereenvoudigen, repareren of verbeteren.
Worden mijn gegevens vertrouwelijk behandeld?
Ja. Je bestanden worden alleen gebruikt voor het afgesproken project. Verwijder of anonimiseer indien mogelijk onnodige persoonlijke of zeer gevoelige informatie.
Wat gebeurt er als mijn data onvolledig of inconsistent is?
Ik identificeer belangrijke datakwaliteitsproblemen en leg uit hoe deze de dashboard of analyse kunnen beïnvloeden. Ik verzin niet stilletjes ontbrekende bedrijfsinformatie.
Wat telt als een revisie?
Een revisie betekent redelijke wijzigingen binnen de afgesproken scope. Nieuwe dashboards, grote structurele veranderingen, aanvullende datasets of nieuwe eisen kunnen een extra opdracht vereisen.
Ontvang ik het bewerkbare Excel-bronbestand?
Ja. De standaard oplevering is meestal een bewerkbaar Excel-werkboek, tenzij we vooraf een andere output overeenkomen.


