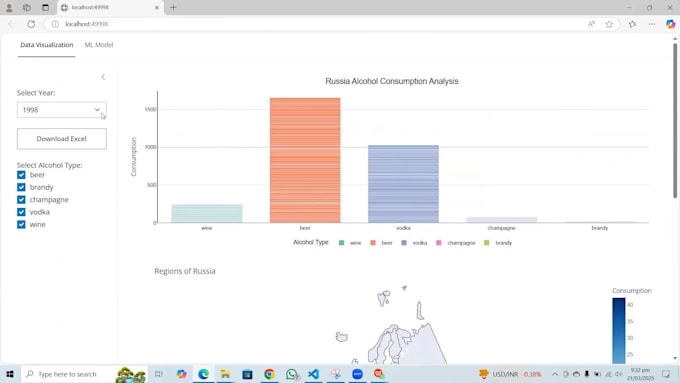
Ik ontwerp een Shiny R Dashboard om data te analyseren voor rapporten.
Je ontvangt een interactieve shiny dashboard van de data.
Er is een downloadoptie om bestanden en grafieken op te slaan.
Het ontwerp is gebruiksvriendelijk en aantrekkelijk voor het oog.
Tool
Glanzend
Grafiektype
Distributie
Locatie
Patronen
Tijdreeks
Heat map
Histogram
Prestaties
Maak kennis met Devannand
Devannand
Data Scientist
5,0(8)
Afkomstig uitPakistan
Lid sindsjun 2024
Gem. reactietijd4 uur
Laatste levering1 maand
Talen
Engels, Duits
Need data-driven solutions that deliver real results?
I transform your raw data into actionable insights using Python, AI, ML, and advanced analytics. Whether you need predictive models, business intelligence dashboards and comprehensive data analysis. With 3+ years of experience, I deliver solutions tailored to your unique challenges.
What you get:
✓ Clear visualizations that inform better decisions
✓ Custom AI/ML solutions for your business problems
✓ Thorough analysis with actionable recommendations
Ready to unlock your data's potential? Let's Connect.