Door categorieën bladeren
Ontdekken
Fiverr Pro
Nederlands
$
USD
I will analyze, clean, transform, and visualize your data to help you identify trends, patterns, KPIs, and actionable insights. I can work with Excel, CSV, SQL, Python, and Power BI.
My services include data cleaning, exploratory data analysis, data visualization, dashboard creation, KPI analysis, and business insights.
I will provide clear results and visualizations that help you understand your data and support better decision-making.
Please contact me before ordering if you have specific requirements or a large dataset.


What types of data can you analyze?
I can analyze data from Excel, CSV, SQL databases, and other structured datasets. I can work with sales, customer, operational, financial, and other business data.
What tools do you use for data analysis?
I use Python, SQL, Power BI, DAX, Power Query, PySpark, and Databricks, depending on the requirements of the project.
Can you clean and transform my data?
Yes. I can clean and transform your data by handling missing values, duplicates, inconsistent formats, and other common data quality issues.
Can you create dashboards in Power BI?
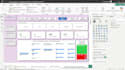
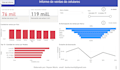
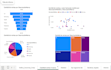
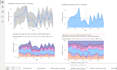
Yes. I can create interactive Power BI dashboards with KPIs, charts, filters, trends, and business insights to make your data easier to understand.
What do you need from me to start?
I need your dataset and a brief explanation of your objectives or business questions. If you have specific KPIs, reports, or visualizations in mind, please share them as well.
Can you provide insights and recommendations?
Yes. I can identify trends, patterns, relationships, anomalies, and key findings in your data and provide clear, actionable insights based on the analysis.
Can you apply Machine Learning to my data?
Yes. I can apply machine learning techniques such as clustering, classification, regression, and anomaly detection, among others to identify patterns, predict outcomes, and generate actionable insights.


