Door categorieën bladeren
Nederlands
$
USD
Koppel je AI aan Fiverr

Automatische vertaling
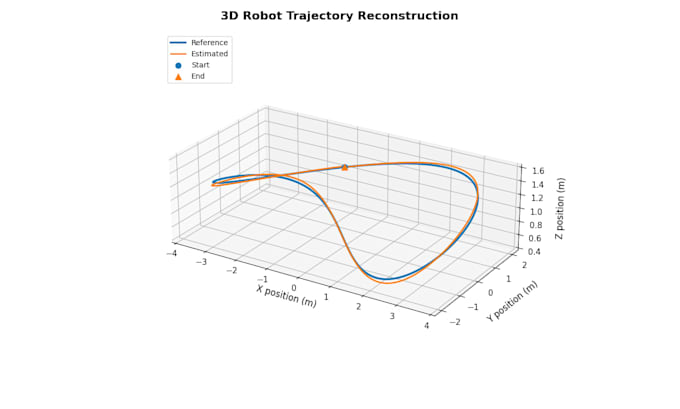
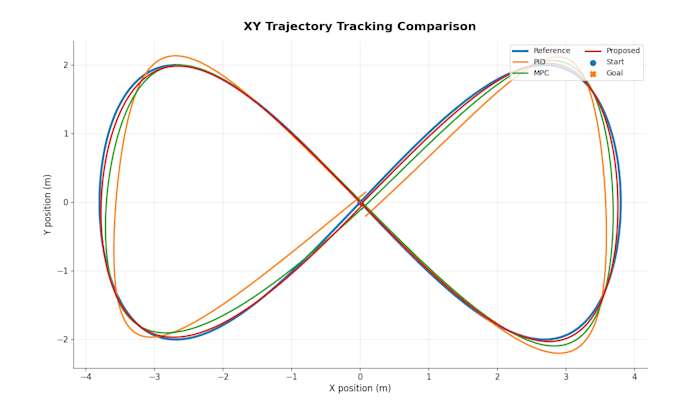
Heb je duidelijke wetenschappelijke grafieken nodig van jouw onderzoek- of engineeringsdata? Ik creëer schone, publicatielijn-achtige visualisaties met Python en Matplotlib.
Diensten omvatten:
Pakketdetails:
Om van start te gaan, lever alsjeblieft jouw data, kolomomschrijvingen, X/Y-variabelen, eenheden, gewenste plottype en eventuele referentiestijl. Ik bevestig de scope voordat ik begin.
Ik communiceer voornamelijk via Fiverr-berichten. Complexe statistische analyses, uitgebreide data-cleaning, interactieve dashboards en web-embedden vereisen een aparte offerte.
Python Developer , Robotics Researcher
Talen
Automatische vertaling
Automatische vertaling
Welke gegevensformaten worden geaccepteerd?
Ik accepteer voornamelijk CSV- en Excel(.xlsx)-bestanden. Voeg zo mogelijk kolomnamen, variabelomschrijvingen en meeteenheden toe.
Kun je mijn ruwe data opschonen of voorbewerken?
Basis omvat het plotten van schone data. Standard bevat lichte opmaak, terwijl Premium basisdatapreparatie omvat. Uitgebreide schoonmaak of complexe statistische bewerkingen vereisen een aparte offerte.
Kun je figuren maken voor academische tijdschriftinzendingen?
Ja. Ik kan schone, tijdschriftachtige wetenschappelijke figuren maken met consistente typografie, labels, eenheden en exportformaten. Lever indien mogelijk de figuurgids van het tijdschrift aan.
Kun je robotica- en experimentele data visualiseren?
Ja. Ik kan robottrajecten, trackingfouten, tijdreeksen en algoritme-prestatiegegevens visualiseren. Lever gestructureerde data aan en leg de variabelen uit.