Door categorieën bladeren
Ontdekken
Fiverr Pro
Nederlands
$
USD

Power BI and Excel Dashboard Developer, Business Data Analytics
Skills
Bekijk mijn diensten
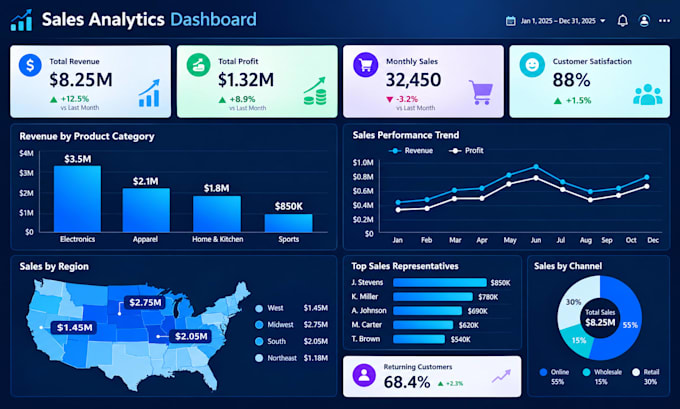
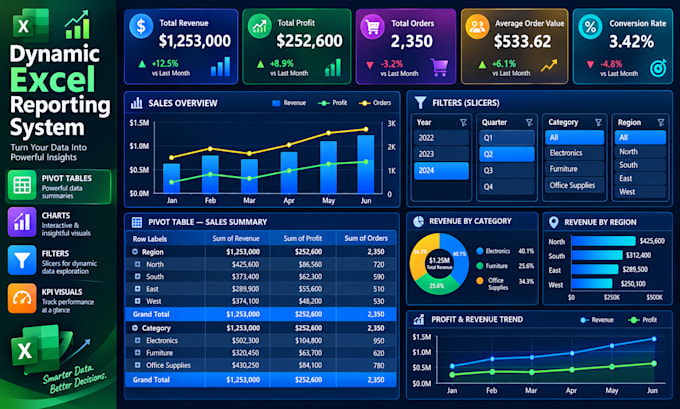

Power BI Dashboard Developer
Freelance
Sep 2024 - Present • 2 yrs 1 mo
Developed interactive Power BI dashboards to help businesses understand their data and monitor key performance indicators. Worked with sales, marketing, and operational datasets to organize information, identify performance trends, and present important metrics through clear visual reports. Created charts, KPI cards, filters, and interactive report pages to make data easier to explore. Used Power Query for data cleaning and transformation and DAX measures for calculations and performance tracking. Focused on building user friendly dashboards that support business reporting, performance analysis, and informed decision making.

Excel Dashboard & Data Reporting Specialist
Freelancing Career
Oct 2023 - Present • 3 yrs
Created structured Excel reports and dashboards for tracking business performance, financial activities, and operational data. Organized raw datasets, applied formulas, and used PivotTables, charts, conditional formatting, and data validation to make reports easier to understand and maintain. Developed reporting solutions for sales analysis, expense tracking, budgeting, cash flow monitoring, inventory management, and KPI reporting. Prioritized data accuracy, clear visual presentation, and practical layouts that help users identify trends, compare results, and monitor important business metrics more efficiently.
