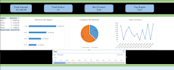
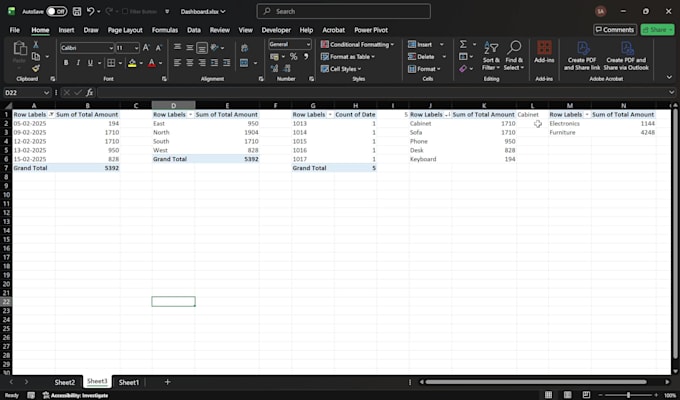
Ik ontwerp een professionele, interactieve Excel dashboard op maat van jouw bedrijfsbehoeften. Met geavanceerde technieken zoals dynamische KPI-kaarten, regionale omzettracking en categorieën breakdowns maak ik rommelige spreadsheets tot hoogwaardige visuele tools.
Wat je krijgt met deze dienst:
- Interactieve functies: Ik voeg functionele tijdlijnen en slicers toe (zoals de datumbesturing voor januari-februari 2025) zodat je direct in je data kunt duiken.
- Samenvatting voor management: Duidelijke visualisatie van belangrijke metrics zoals Totaalbedrag, Totaal bestellingen en Top presterende regio’s.
- Professionele uitstraling: Strakke, moderne layouts (inclusief high-contrast dark modes) ontworpen voor presentaties in de boardroom.
- Verscheidenheid aan grafieken: Expertgebruik van staafdiagrammen voor vergelijkingen, lijngrafieken voor trends en cirkeldiagrammen voor verdelingen.