Het lijkt erop dat deze dienst tijdelijk niet beschikbaar is

I will create data visualisations in python

F
fab311
F
fab311
fab311
Sommige informatie wordt in het Engels weergegeven.

Over deze dienst

Hi there!

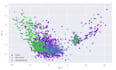
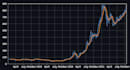
I'm a graduate data scientist and love creating data visualizations in Python.


I can help you creating the most suitable and exceptional data visualization for your project using Python (Matplotlib, Seaborn, Plotly, etc.)


Basic Plots:

  • Scatter plot
  • Bar plot
  • Line plot
  • Area
  • Pie

Distributions:

  • Histograms
  • Boxplots
  • ECDF
  • Violin Plot


Please get in touch before placing an order so we can discuss the specifications beforehand!


Maak kennis met fab311

fab311
  • Afkomstig uitVerenigd Koninkrijk
  • Lid sindssep 2021
  • Talen

    Italiaans, Engels
Hi! I'm an enthusiast graduate data scientist and I love a good looking data visualisation! Feel free to contact me if you need clear and effective charts to gain insight from your data.