Door categorieën bladeren
Ontdekken
Fiverr Pro
Nederlands
$
USD

Automatische vertaling
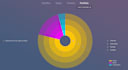
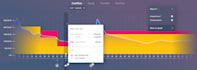
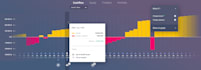
Financiële grafieken zijn handig om te achterhalen wat het inkomen is in de komende X maanden of jaren bij een bepaald dividendpercentage. Ik maak een dynamische lijngrafiek met extra controls: zoals update percentage, dividendopbrengst, belastingtarief, enzovoort.
OPMERKING! Stuur geen bestelling zonder dit eerst met mij te bespreken.
Senior Fullstack and data visualization Engineer
Talen
Automatische vertaling
Automatische vertaling
Krijg ik tijdens de werkzaamheden een interactieve demo?
Ja, ik zet een privé github repository op en maak een demo op github pages
Moet ik gegevens verstrekken?
Het is beter om uw gegevens te verstrekken, maar ik kan ook dummygegevens maken volgens uw vereisten.


