Door categorieën bladeren
Ontdekken
Fiverr Pro
Nederlands
$
USD

Automatische vertaling
Hoi!
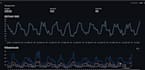
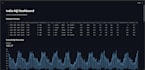
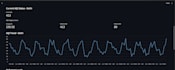
Ik bouw interactieve GIS- en data-analyse dashboards met Python, Streamlit en geospatiale visualisatietools.
Ik kan je helpen met:
Interactieve Streamlit dashboards
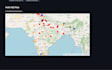
GIS & geospatiale visualisatie
AQI- en milieudashboards
Klimaat- en vervuilingsanalyses
KPI-dashboards en grafieken
Tijdreeksanalyse
CSV/Excel data visualisatie
Interactieve Folium-kaarten
Heatmaps en puntkaarten
Dashboard filtering en analytics
Tools & technologieën:
Python
Streamlit
Pandas
Folium
Matplotlib
Plotly
QGIS
Wat je ontvangt:
Professionele dashboard UI
Interactieve visualisaties
Schoon en georganiseerd code
Snelle communicatie
Bronbestanden inbegrepen
Perfect voor:
Studenten
Onderzoekers
GIS-projecten
Milieuanalyses
Data-analyse projecten
Academisch en portfolio werk
Neem contact met mij op voordat je een bestelling plaatst om projectvereisten te bespreken.
I will create professional GIS maps using QGIS
Talen
Automatische vertaling
Automatische vertaling
Welke dataformaten ondersteun je?
CSV, Excel, GeoJSON, Shapefile en ruimtelijke datasets.
Welke hulpmiddelen gebruik je?
Python, Streamlit, Folium, Pandas, Matplotlib en QGIS.
Kun je aangepaste milieudashboards maken?
Ja, inclusief AQI, vervuiling, klimaat, ontbossing en heatmap projecten.
Geef je de broncode?
Ja.


