Ik maak heldere en inzichtelijke data visualisaties

J
justfred_
J
justfred_
Frederic S.
Sommige informatie is automatisch vertaald.

Over deze dienst

Automatische vertaling

<pHeb je data, maar geen idee hoe je het moet presenteren? Ik zet je ruwe cijfers om in overzichtelijke, professionele grafieken en diagrammen die echt een verhaal vertellen.

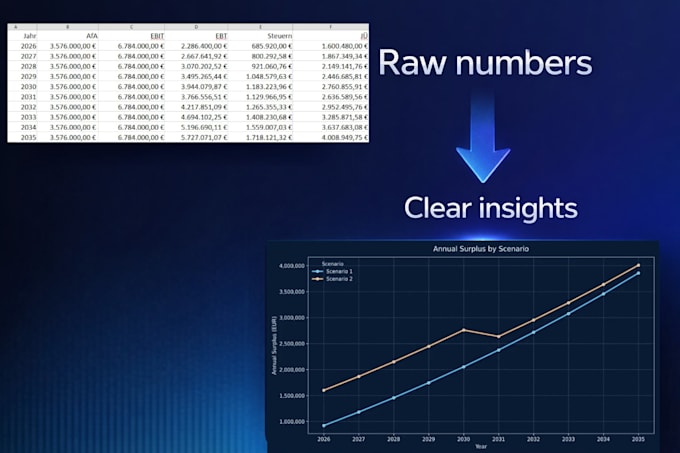
Ik werk met CSV, Excel, JSON of andere gestructureerde data die je aanlevert en maak visualisaties met Python (Matplotlib, Seaborn, Plotly), Excel of andere tools. Of het nu voor een rapport, een presentatie of interne analyse is, ik zorg dat het resultaat duidelijk, nauwkeurig en er goed uitziet.


Wat ik van jou nodig heb:

  • Je data bestand (CSV, Excel, etc.)
  • Een korte beschrijving van wat je wilt laten zien


Wat je krijgt:

  • Grafiekbestanden in hoge resolutie (PNG/PDF of interactieve HTML, of direct in je Excel-bestand)
  • Een schoon Python script zodat je de grafieken altijd opnieuw kunt maken (als het via Python gebeurt)
  • Snelle levering en revisies inbegrepen


Weet je niet welk soort grafiek het beste bij je data past? Beschrijf gewoon je doel, ik zoek de beste vorm voor je.

Maak kennis met Frederic S.

Frederic S.

Software Automation

3,0(1)
  • Afkomstig uitDuitsland
  • Lid sindsdec 2019
  • Gem. reactietijd1 uur
  • Laatste levering5 jaar
  • Talen

    Duits, Engels
Got a repetitive task slowing you down? I’ll automate it. I’m a Python developer with 3+ years of experience helping businesses save time through smart automation. From Excel workflows to data cleaning, visualization, and custom scripts — I turn your ideas into fast, working solutions. What I offer: * Excel & spreadsheet automation * Data cleaning, analysis & visualization * Workflow automation scripts * Custom Python solutions Not sure if it’s doable? Just ask — I’ll tell you honestly what’s possible and how long it’ll take.

Automatische vertaling