Door categorieën bladeren
Ontdekken
Fiverr Pro
Nederlands
$
USD

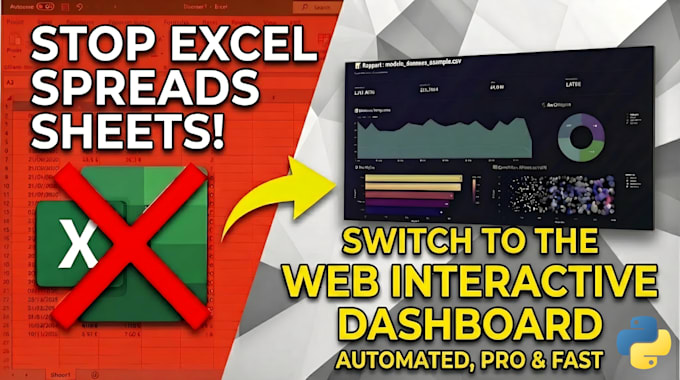
Stop staring at static spreadsheets.
Are you struggling with heavy Excel files that crash or are impossible to read on mobile? I transform your raw data (Excel, CSV, Google Sheets) into a modern, secure, and interactive Web Application using Python & Streamlit.
Why switch to a Streamlit Dashboard?
What I visualize: Sales & Revenue Performance Financial Forecasting Inventory & Stock Management HR Analytics
My Packages:
Why me? I design tools that grow your business. Fast communication, clean design & 100% data confidentiality.
Ready to modernize? Choose a package or contact me for a custom quote!
Python Developer Data Visualization, Web Scraping and Automation
Talen
What files do I need to provide?
I need your data source (Excel, CSV, Google Sheets, or JSON). Please ensure the data is structured (columns and rows). If your data requires complex cleaning or merging multiple files, please contact me first for a custom quote.
How do I run the dashboard on my computer?
By default, I deliver a Python script (.py). You need to have Python installed on your machine to run it. If you don't want to install anything, please select the "Standalone .exe file" gig extra, and I will convert it into a simple Windows application.
Can you connect the dashboard to my live Google Sheet?
Yes! Please select the Premium Package (or add the extra service). I will set up the API connection so your dashboard updates automatically in real-time whenever you edit your Google Sheet.
Is the dashboard mobile-friendly?
Yes, the technology I use (Streamlit) is responsive. The layout adapts to smartphone screens. However, for complex financial dashboards with many columns, a desktop or tablet view is recommended for the best experience.
Is my data safe with you?
100%. I treat your data with strict confidentiality. I only use it to build your dashboard, and I delete all files from my local machine immediately after the order is completed.
Can I share the dashboard with my team?
Yes. If you choose the Premium Package (Cloud Deployment), I will host the app on a secure cloud server and give you a private URL (link) that you can share with anyone, just like a website.