Ik maak een interactieve 3D wereldbol visualisatie

L
lalichidrashvil
L
lalichidrashvil
Lali Ch.
Sommige informatie is automatisch vertaald.

Over deze dienst

Automatische vertaling

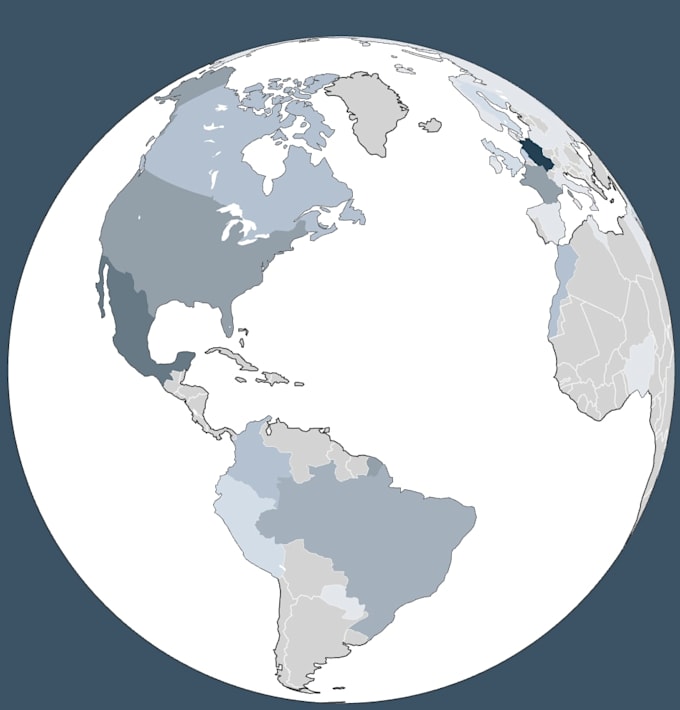
Ik maak interactieve 3D wereldbol visualisaties met D3.js, ontworpen om geografische en landgegevens op een duidelijke, boeiende en intuïtieve manier te presenteren.


Wat je krijgt:

  • Een aangepaste interactieve 3D wereldbol op basis van jouw data
  • Landmarkering met hover tooltips
  • Vloeiende rotatie en gebruikersinteractie
  • Responsieve, webklare visualisatie
  • Net, herbruikbaar, productieklare code


Stuur me een bericht voordat je bestelt, zodat we kunnen afstemmen over scope, datavorm en verwachtingen.


Voorbeeld portfolio:

lali.dev/project/globe

Maak kennis met Lali Ch.

Lali Ch.

D3 js charts, dashboards, and maps

  • Afkomstig uitGeorgië
  • Lid sindsfeb 2022
  • Gem. reactietijd1 uur
  • Talen

    Georgisch, Engels
I create interactive data visualizations using D3.js and modern JavaScript frameworks. I specialize in transforming complex data into transparent, intuitive, and visually appealing charts, dashboards, and maps. I work with: - D3.js for custom, high-quality data visualizations - React & Svelte for responsive data-driven applications - Mapbox & Maplibre for interactive maps and geospatial visualizations With experience in financial data, I focus on accuracy, clarity, and meaningful storytelling through visuals.

Automatische vertaling