Ik maak python data visualisaties

L
lekhana_bc
L
lekhana_bc
Lekhana B
Sommige informatie is automatisch vertaald.

Over deze dienst

Automatische vertaling

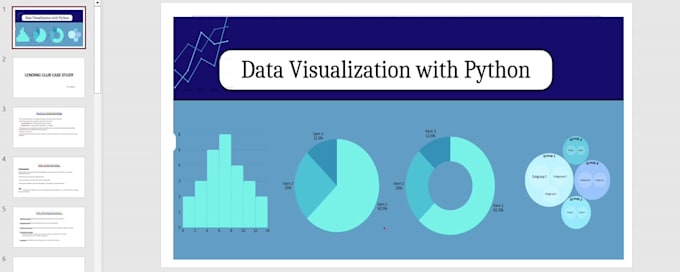
Python Data Visualisatie | Matplotlib, Seaborn & Plotly Grafieken


Wat ik aanbied:

  • Maak hoogwaardige statische & interactieve grafieken (staaf, lijn, cirkel, scatter, box, histogram)
  • Data schoonmaken & preprocessing
  • Exploratieve Data Analyse (EDA) voor trends & patronen
  • Lever Python code & publicatieklare grafieken
  • Geef inzichten voor rapporten, presentaties of bedrijfsanalyse

Tools:

Python, Pandas, Matplotlib, Seaborn, Plotly


Pakketten:

Basis: Grafiek maken alleen (geen analyse)

Standaard: Data schoonmaken + Basis EDA + Grafieken + Samenvatting rapport

Premium: Volledige EDA + Interactieve grafieken + Inzichten + ML-geschikte dataset

Maak kennis met Lekhana B

Lekhana B

Professional data analysis and visualization for business decision

  • Afkomstig uitIndia
  • Lid sindsaug 2025
  • Talen

    Engels
I’m Lekhana, a Data Analyst with 5+ years of IT experience in Technical support, Incident management, and Data analysis. Currently upskilling with an Artificial Intelligence/Machine Learning Post Graduate course from IIITB & UpGrad. I help businesses clean messy data, automate reports, and create dashboards for faster decisions. Skilled in Excel, SQL, Python and visualization. I’ve worked on loan data analysis, default prediction, waste image projects and many more . Let’s make your data simple and actionable—contact me for tailored solutions

Automatische vertaling

Mijn portfolio

Gerelateerde tags