Sommige informatie wordt in het Engels weergegeven.
Over mij
I turn raw data into clear, visual stories that help businesses make better decisions.
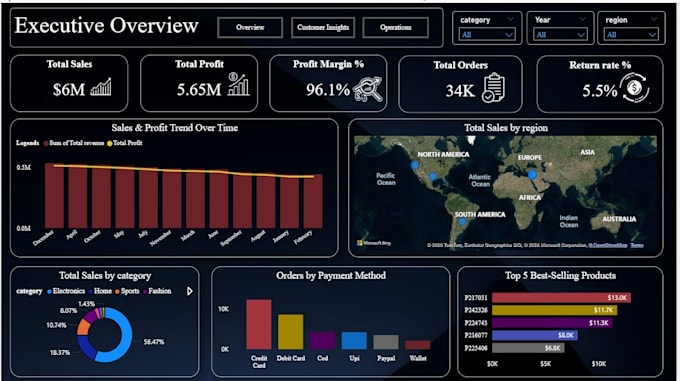
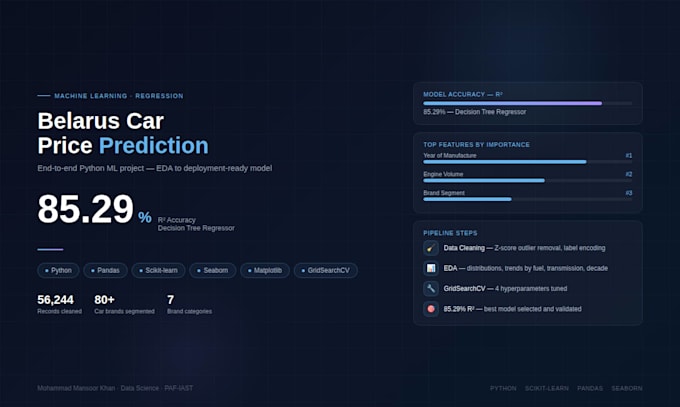
I specialize in building interactive dashboards in Power BI and Tableau, and performing end-to-end data analysis using Python (Pandas, Seaborn, Plotly, Scikit-learn).
What I deliver:
→ Power BI & Tableau dashboards with KPIs, filters, and DAX
→ Python data analysis, cleaning & EDA
→ Interactive Data visualization for businesses
Fast delivery. Clean output. I don't stop until the data makes sense.... Lees meer