Door categorieën bladeren
Ontdekken
Fiverr Pro
Nederlands
$
USD


Automatische vertaling
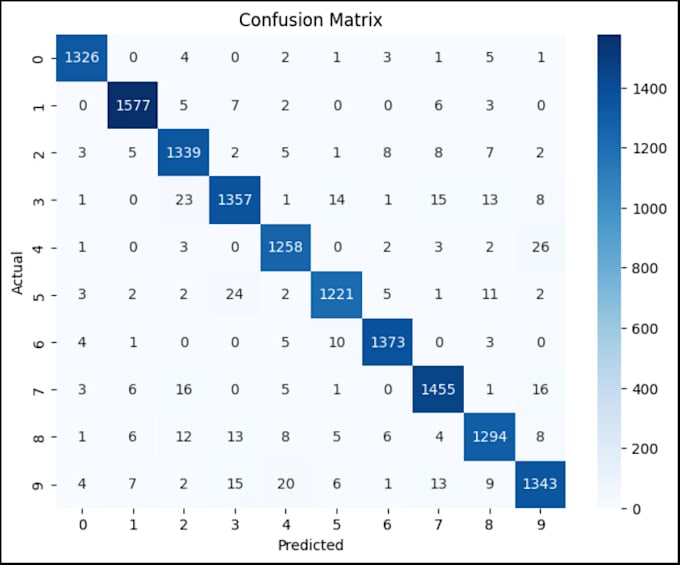
Ben je op zoek naar heldere, inzichtelijke en professionele data visualisaties?
Ik ben gespecialiseerd in het maken van hoogwaardige plots en grafieken met Python, Matplotlib en Pandas. Of je nu gebruikersactiviteit wilt visualiseren, trends wilt analyseren of statistische samenvattingen wilt genereren, ik help je graag.
Mijn diensten omvatten:
Histogrammen (zoals "Uren Besteed aan Social Media")
Lijn- grafieken, staafdiagrammen, scatterplots
Aangepaste styling, labels, titels, rasterlijnen
Export naar hoge resolutie PNG/PDF
Ondersteuning voor Python 2.7 of 3.x omgevingen
Ik bied ook visualisatieondersteuning voor onderzoek, presentaties en dashboard-geschikte graphics.
Laten we je data omzetten in een verhaal!
Stuur me een bericht met je dataset of probleem voordat je bestelt.
Talen
Automatische vertaling