Door categorieën bladeren
Ontdekken
Fiverr Pro
Nederlands
$
USD


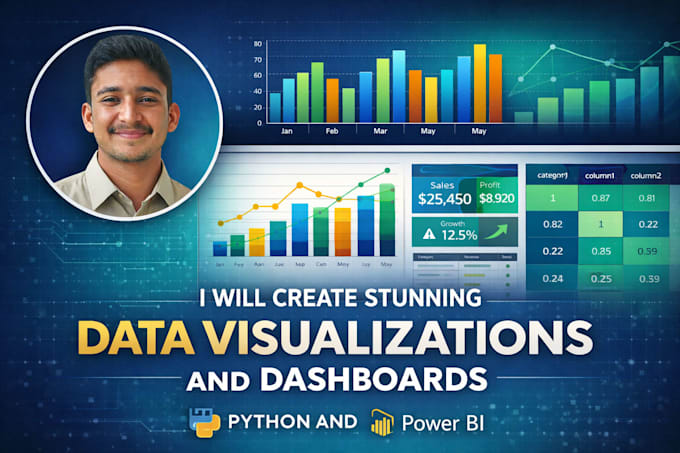
Turn Your Boring Spreadsheets into Stunning Visual Stories
Hi, I'm a Python Developer and Data Visualization Specialist. I transform raw numbers into clear, beautiful charts and dashboards that help you understand your data instantly.
WHAT I CREATE
STATIC CHARTS Bar, line, pie, scatter, histograms, heatmaps, box plots
INTERACTIVE DASHBOARDS Power BI with filters, slicers, real-time data
CUSTOM VISUALS Tailored to your brand, report, or presentation
EXPLORATORY ANALYSIS Visual summaries that reveal hidden trends
PUBLICATION-READY High-res images for reports, papers, websites
️ MY TOOLKIT
Python: Matplotlib, Seaborn, Plotly
Power BI: Interactive dashboards, DAX, data modeling
Excel: Charts, pivot charts, conditional formatting
Output: PNG, SVG, PDF, HTML, Power BI files
YOU WILL RECEIVE
️ High-quality, publication-ready visuals
️ Interactive dashboard file (Power BI / HTML)
️ Clean, reusable Python code (optional)
️ Data preprocessing included
️ Fast delivery 24-48 hours
WHY CHOOSE ME?
IBM CERTIFIED Data Visualization with Python
50+ projects delivered proven experience
NOT just "pretty charts" I focus on accuracy & clarity
100% satisfaction
Message me before ordering
Python Data Science and ML Developer
Talen
What kind of data can you visualize?
Any structured data: Excel, CSV, JSON, SQL exports, sales data, survey results, financial reports, research data – anything with numbers or categories.
Do you create interactive dashboards?
Yes! My PREMIUM package includes a fully interactive Power BI dashboard with filters, slicers, and drill-down capabilities.
Can you help me choose the right chart type?
Absolutely. I don't just create what you ask – I recommend the best visual for your data story. That's included free.
Will I get the Python code?
In STANDARD and PREMIUM packages, yes. You'll receive well-commented Python code so you can recreate or modify the visuals.
What if I don't have a clear idea of what I need?
No problem! Share your data and your goal (e.g., "show sales trends" or "compare product performance"). I'll propose the best visuals.
Can you match my brand colors and style?
Yes! Share your brand guidelines or examples of styles you like, and I'll customize the visuals accordingly.
How fast can you deliver?
BASIC in 1 day, STANDARD in 2 days, PREMIUM in 3 days. Need it faster? Add the "Extra fast delivery" gig extra.