Door categorieën bladeren
Nederlands
$
USD
Koppel je AI aan Fiverr



Before placing an order please contact me to go through your requirements.
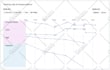
Data visualizations in the form of graphs and charts are a way to establish a relationship between two or more quantities. In this gig, I'd create beautiful, scalable, and responsive charts and graphs for your website or web app using D3 JS.
D3(Data-Driven Documents) is a javascript library for creating charts or graphs of any kind using HTML, CSS, and SVGs. With D3, you can create charts or graphs of the following kinds:
I have been working with D3 JS for the past year and I have a lot of experience with the Library. If you need charts for your dashboard or any part of your website and web app, this is the gig for you.
Do consider reaching out for more information or clarification. I look forward to doing business with you. Adios!!
Frontend Developer who specialises in building complex UIs
Talen
| (40) | ||
| (0) | ||
| (0) | ||
| (0) | ||
| (0) |
aventuresde

Duitsland
Malvin did an excellent good job and was able to find solutions for all upcoming problems.
US$ 200-US$ 400
Prijs
10 dagen
Looptijd
roppert

Verenigde Staten
The visuals look great!
US$ 200-US$ 400
Prijs
2 dagen
Looptijd
roppert
Verenigde Staten
Created an amazing data visual with all the interactions I wanted!
US$ 200-US$ 400
Prijs
4 dagen
Looptijd

luctenhave

Nederland
Malvin built a new application for my stock chart evaluation. Took a bit longer than we both expected, but frankly that is the experience with almost any application I had built by web developer, as the scope changes as you’re working away. End product works well and happy with Malvins service
US$ 400-US$ 600
Prijs
4 weken geleden
Looptijd
alsinabh

Saoedi-Arabië
Easy communication and fast response
US$ 200-US$ 400
Prijs
8 dagen
Looptijd
| (40) | ||
| (0) | ||
| (0) | ||
| (0) | ||
| (0) |
aventuresde
Duitsland
Malvin did an excellent good job and was able to find solutions for all upcoming problems.
US$ 200-US$ 400
Prijs
10 dagen
Looptijd
roppert
Verenigde Staten
The visuals look great!
US$ 200-US$ 400
Prijs
2 dagen
Looptijd
roppert
Verenigde Staten
Created an amazing data visual with all the interactions I wanted!
US$ 200-US$ 400
Prijs
4 dagen
Looptijd
luctenhave
Nederland
Malvin built a new application for my stock chart evaluation. Took a bit longer than we both expected, but frankly that is the experience with almost any application I had built by web developer, as the scope changes as you’re working away. End product works well and happy with Malvins service
US$ 400-US$ 600
Prijs
4 weken geleden
Looptijd
alsinabh
Saoedi-Arabië
Easy communication and fast response
US$ 200-US$ 400
Prijs
8 dagen
Looptijd


