Ik maak interactieve data visualisaties met Flourish

M
mhamedoublal
M
mhamedoublal
Mohamed O
Sommige informatie is automatisch vertaald.

Over deze dienst

Automatische vertaling

Ben je op zoek naar professionele en interactieve data visualisaties?

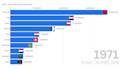
Ik maak geweldige geanimeerde grafieken, bar chart race-video's en interactieve data visualisaties met Flourish Studio.

Mijn diensten omvatten:

  • Bar chart race animaties
  • Interactieve grafieken en diagrammen
  • Statistiekvideo's voor YouTube en TikTok
  • Data visualisatie dashboards
  • Professioneel en strak ontwerp

Waarom voor mij kiezen?

  • Hoge kwaliteit visuals
  • Snelle levering
  • Professionele communicatie
  • Aandacht voor detail

Ik werk met Excel, CSV en statistische data om boeiende en visueel aantrekkelijke content te maken voor jouw publiek of bedrijf.

Neem gerust contact met me op voordat je bestelt.

Maak kennis met Mohamed O

Mohamed O
  • Afkomstig uitMarokko
  • Lid sindsjun 2025
  • Gem. reactietijd1 uur
  • Talen

    Arabisch, Engels, Frans
Are you looking for clean, insightful, and interactive reports? You're in the right place! I specialize in building professional dashboards and data reports using Power BI and Excel, helping businesses visualize their data clearly and make smarter decisions. 🔧 What I Can Do for You: ✅ Clean and prepare your data using Power Query ✅ Design modern, responsive dashboards ✅ Connect to data from Excel, SQL, web APIs, and more ✅ Optimize your reports for clarity and fast performance ✅ Deliver complete solutions with support and guidance ✅ Guarantee full confidentiality and professionalism

Automatische vertaling

Gerelateerde tags