Door categorieën bladeren
Nederlands
$
USD
Koppel je AI aan Fiverr



Automatische vertaling
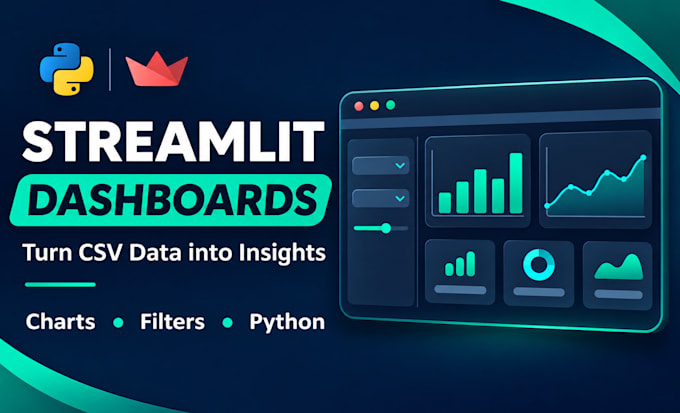
Zet jouw CSV-gegevens om in een helder, interactief Streamlit-dashboard gebouwd met Python.
Het starterspakket bevat één pagina, één voorbereide CSV-dataset, tot drie grafieken en één eenvoudige filter. Je ontvangt Python-broncode, een lijst met dependencies en instructies om de app lokaal uit te voeren.
Mijn persoonlijke Earthquake Data Explorer laat kaarten, catalogusfilters, beschrijvende statistieken en CSV-export zien met Python, Pandas en Streamlit. Jouw dashboard richt zich op de vragen die jij wilt dat jouw data beantwoordt.
Voordat je bestelt, stuur een geïndividualiseerd anoniem sample CSV-bestand, de grafieken of metrics die je nodig hebt en een voorbeeldindeling als je die hebt. We komen vooraf overeen welk dataformaat en welk dashboardgedrag gelden voordat het werk begint.
Excel-inputs, extra pagina’s, complexe schoonmaak, live API’s of databases, deployment en doorlopende hosting vereisen een aangepaste offerte. Doorlopende onderhoud is niet inbegrepen.
Python Developer, Excel and CSV Automation, Streamlit Dashboards
Talen
Automatische vertaling
Automatische vertaling
Wat moet ik aanleveren?
Stuur een geanonimiseerde CSV, de vragen die je beantwoord wilt hebben, en jouw gewenste grafieken of statistieken. Het starterspakket gebruikt één kant-en-klare dataset; dataopschoning en Excel-invoer vereisen een aparte scope-check.