Door categorieën bladeren
Ontdekken
Fiverr Pro
Nederlands
$
USD


Welcome! Need to transform complex raw data into production-ready visual intelligence? You are in the right place.
I am a Machine Intelligence & Data Science engineer specialized in developing custom, high-performance web applications and dynamic data dashboards using Python and Plotly Dash.
What I can deliver for your business:
* Full-stack data pipelines using Pandas and NumPy to clean and optimize complex datasets.
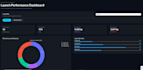
* Multi-page interactive dashboards with modern dark/light UI logic.
* Advanced geospatial mapping and success clusters integration via Folium.
* High-speed, real-time data filters, heat maps, and time-series analytics.
* Seamless integration of mathematical modeling or telemetry analysis into visuals.
Why choose me?
I focus on building production-ready, highly interactive solutions tailored precisely to your operational goalsensuring technical depth and scannable visual designs.
Please contact me before placing an order so we can align on your dataset specifications and system architecture!
AI Engineering, Data Science, and Agentic Workflows
Talen
What do I need to provide to get started?
You just need to provide your dataset (CSV, Excel, SQL database, or API endpoint) along with a brief description of the core metrics or insights you want to track on the dashboard.
Which Python frameworks do you use for development?
I primarily develop using Dash by Plotly, Pandas, NumPy, and Folium for geospatial data. For backend microservices, I optimize using Python environment architectures.


