Ik maak de grafische voorstelling van je data

M
mrunastatistics
M
mrunastatistics
Mrunastatistics
Sommige informatie is automatisch vertaald.

Over deze dienst

Automatische vertaling

***Neem contact met mij op voordat je je bestelling plaatst om te bespreken wat je precies nodig hebt.***

Loop je tegen uitdagingen aan bij het verwerken van je statistische werk?

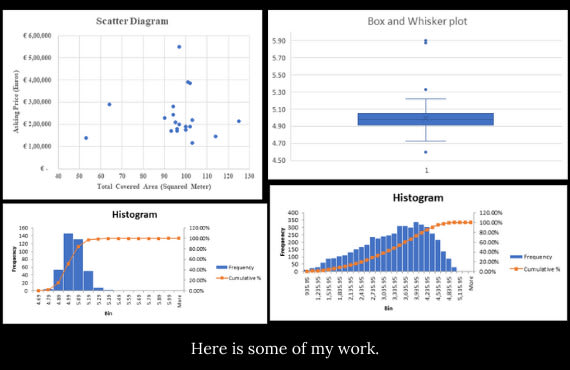
Heb je een gedetailleerde visualisatie van je data nodig?

Ik help je bij:

  • Voorlopige data-analyse
  • Descriptieve data-analyse

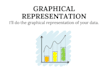
Grafische voorstelling omvat vooral:

  • Histogram
  • Staafdiagram of bar chart of staafgrafiek
  • Druppelplot
  • Frequentiepolygon
  • Cumulatieve frequentiecurve of ogief
  • Lijngrafiek of staafgrafiek
  • Pizza diagram
  • Lijngrafiek of tijdplot
  • Stam en blad plot
  • Boxplot
  • Scatter plot
  • Frequentieverdeling

En nog veel meer.

Ik visualiseer je data handmatig of met behulp van R studio, MS Excel of Python programmering.

Bekijk mijn andere gigs om meer onderwerpen te ontdekken.

Dank je wel.

Maak kennis met Mrunastatistics

Mrunastatistics

Transforming data into measurable insights

5,0(72)
  • Afkomstig uitIndia
  • Lid sindsaug 2020
  • Gem. reactietijd1 uur
  • Laatste levering1 jaar
  • Talen

    Engels, Marathi, Hindi
Hi, I’m Mrunal, a Data Analyst with a postgraduate degree in Statistics, specialising in transforming raw data into clear and actionable insights. I work on data cleaning, exploratory data analysis, Power BI dashboard development, statistical analysis, hypothesis testing, Excel reporting, SQL querying, and academic or research support. I help businesses, students, and professionals make informed decisions through structured analysis and effective data visualisation, with a strong focus on accuracy, clarity, and timely delivery of high-quality results. I look forward to collaborating with you.

Automatische vertaling

Andere Datavisualisatie diensten die ik aanbied