Door categorieën bladeren
Ontdekken
Fiverr Pro
Nederlands
$
USD


Automatische vertaling
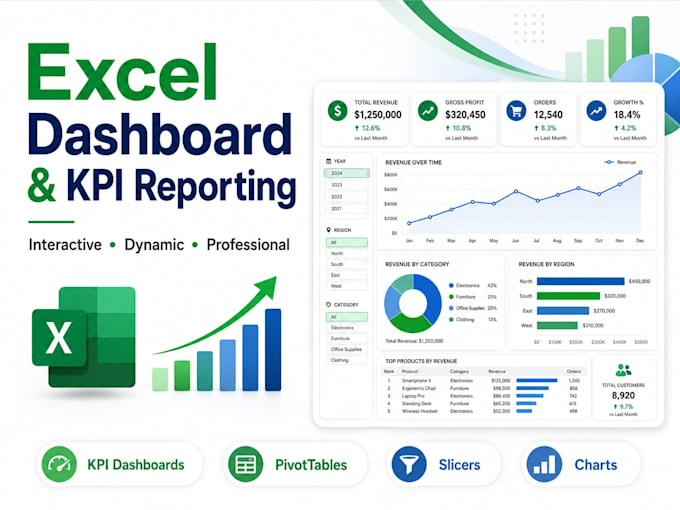
Zet je bedrijfsgegevens om in een duidelijk, professioneel en interactief Excel-dashboard dat prestaties gemakkelijk inzichtelijk maakt.
Ik kan aangepaste Excel-dashboards maken voor verkoop, financiën, operaties, marketing, voorraad, projecten of andere bedrijfsrapportagebehoeften.
Afhankelijk van je pakket kan je dashboard onder andere bevatten:
Ik richt me op het bouwen van dashboards die niet alleen visueel overzichtelijk zijn, maar ook praktisch en gebruiksvriendelijk.
Je ontvangt een overzichtelijk Excel-werkboek dat is ontworpen rondom jouw data, KPI's en rapportage doelen.
Voor meerdere bestanden, complexe datasets, terugkerende rapporten of geavanceerde data-source verbindingen, neem vooraf contact met me op zodat ik het juiste pakket kan aanbevelen of een op maat gemaakte offerte kan maken.
Data Analyst, Excel, Power BI and Survey Analysis
Talen
Automatische vertaling
Automatische vertaling
Wat heb je van mij nodig om het Excel-dashboard te maken?
Stuur alstublieft je Excel-, CSV- of Google Sheets-data, de KPI's of metrics die je wilt volgen, en eventuele voorkeuren voor layout of rapportagestijl. Als je niet zeker weet welke KPI's je moet gebruiken, help ik je graag met het structureren ervan op basis van je doelen.
Kun je mijn data opschonen voordat je het dashboard bouwt?
Ja. Standaard- en Premium-pakketten kunnen data cleaning, formatting, duplicaatcontrole, standaardisatie en voorbereiding vóór het dashboard-ontwikkelingsproces omvatten.
Wordt het dashboard interactief?
Ja, voor Standaard- en Premium-pakketten. Ik kan slicers, filters, PivotTables, PivotCharts en dynamische formules gebruiken zodat je de data interactief kunt verkennen.
Kun je dashboards maken voor elk type bedrijfsdata?
Ja. Ik kan werken met verkoop-, financiën-, operaties-, voorraad-, marketing-, projecttracking-, HR-, klant- en andere gestructureerde bedrijfsdatasets.
Kan het dashboard updaten als ik nieuwe data toevoeg?
Ja, afhankelijk van hoe je data is gestructureerd. Ik kan werkstromen voor rapportages ontwerpen die hernieuwbaar zijn, gebruikmakend van Excel-tabellen, PivotTables, formules en Power Query waar nodig.
Kun je data combineren van meerdere Excel-bestanden of bladen?
Ja. Meerdere bestanden of werkbladen kunnen worden gecombineerd wanneer hun structuren compatibel zijn. Neem vooraf contact met me op als je meerdere bestanden of complexe data bronnen hebt.
Bied je Power BI dashboards aan in deze dienst?
Nee. Deze dienst is specifiek voor Microsoft Excel dashboards. Als je Power BI nodig hebt, neem dan apart contact met me op.
Kun je een bestaand dashboard ontwerp of rapportageformat van een bedrijf matchen?
Ja. Als je een bestaand rapport, screenshot, sjabloon of merkstijl hebt, stuur het mee met je bestelling en ik kan de stijl zo dicht mogelijk volgen.
Wat als mijn dataset groter is dan de limiet van het pakket?
Stuur me een bericht met het geschatte aantal rijen, bestanden en benodigde dashboard functies. Ik kan een op maat gemaakte offerte maken voor grotere of complexere projecten.
Ontvang ik het bewerkbare Excel-bestand?
Ja. Je ontvangt het voltooide Excel-werkboek zodat je het dashboard na levering kunt blijven gebruiken en bijwerken.
