Door categorieën bladeren
Nederlands
$
USD
Koppel je AI aan Fiverr

Automatische vertaling
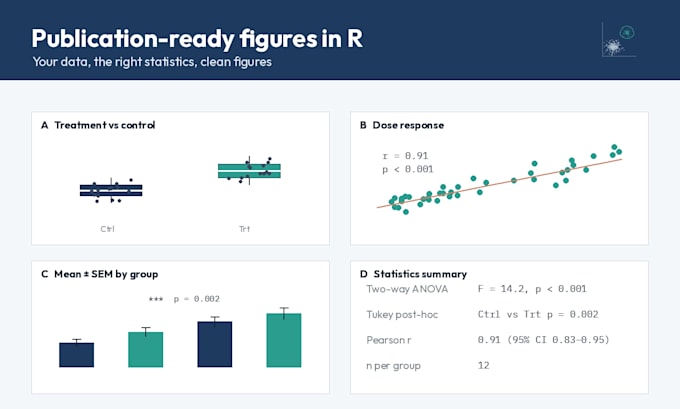
Zet je experimentele of enquêtegegevens om in duidelijke, publicatieklare grafieken met de juiste statistieken erachter.
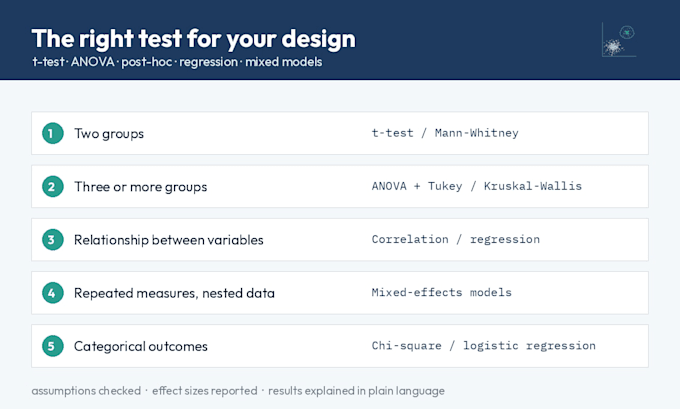
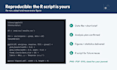
Ik ben een PhD-wetenschapper met jarenlange ervaring in het analyseren van laboratoriumgegevens in R. Ik kies de statistische test die bij jouw ontwerp past, voer deze correct uit en presenteer de resultaten in figuren die reviewers, begeleiders en klanten in één oogopslag begrijpen.
Wat je krijgt:
Je stuurt de data en vertelt me welke vergelijkingen je nodig hebt; ik bevestig de aanpak voordat ik begin. Ik analyseer alleen de data die je aanlevert, precies zoals ze zijn.
Biochemist PhD in Chemical Sciences Immunology
Talen
Automatische vertaling
Automatische vertaling
Welk dataformaat heb je nodig?
Excel of CSV, één rij per observatie, met een korte uitleg over wat elke kolom betekent. Exporten uit Google Sheets zijn ook prima.
Maak je data zelf of pas je ze aan?
Nee. Ik analyseer alleen de data die je aanlevert, precies zoals ze zijn. Ik kan de figuurrichtlijnen van een tijdschrift volgen als je die stuurt.