I will deploy your interactive r shiny dashboard using shiny server

R
redatkl
R
redatkl
Reda T.
Sommige informatie wordt in het Engels weergegeven.

Over deze dienst

PLEASE DON'T PLACE AN ORDER UNTIL WE DISCUSS ITS DETAILS IN PRIVATE

Contact me first

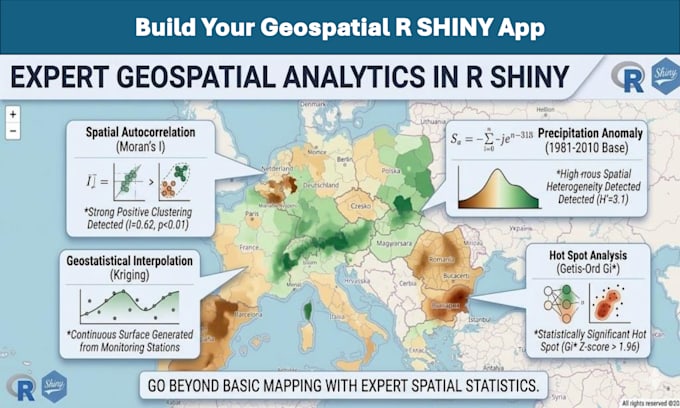
Need to transform raw geographical data into a professional, high-performance web app? I specialize in full-stack R Shiny development, bridging the gap between advanced spatial data science and premium UI/UX design.

What I deliver:

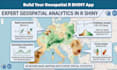
  • Advanced Spatial Analysis: Going beyond basic maps. I implement rigorous spatial statistics (e.g., Moran's I, Shannon's Entropy, Kriging) directly into your app.
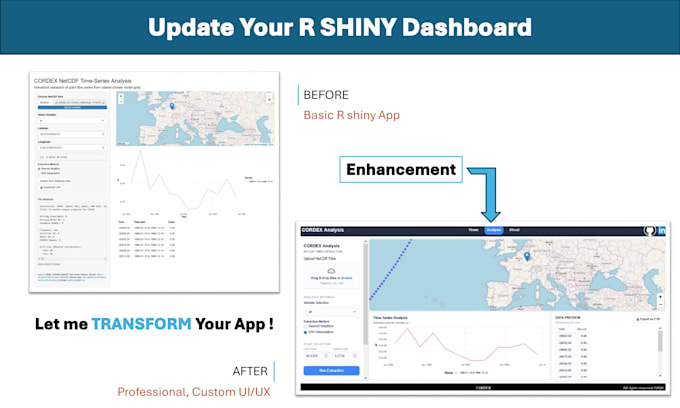
  • Premium UI/UX: Transforming standard Shiny layouts into modern, responsive interfaces with custom CSS/JS and Mapbox/Leaflet integrations.
  • Robust Data Pipelines: Expert spatial data wrangling using dplyr and highly customized ggplot2 reactive visualizations.
  • Machine Learning Integration: Embedding predictive models (Random Forest, XGBoost, SVM) into your dashboard for tasks like risk severity mapping or environmental monitoring.
  • Raster & Satellite Data: Processing heavy datasets, integrating Sentinel-2 imagery, and calculating indices like NDVI on the fly.
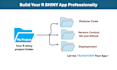
  • Production-Ready Architecture: Building modular, highly scalable apps using the GOLEM framework.

Let's build a tool that drives real decision-making.

Maak kennis met Reda T.

Reda T.

Precise, Fast and Respect

5,0(3)
  • Afkomstig uitMarokko
  • Lid sindsokt 2018
  • Gem. reactietijd1 uur
  • Laatste levering8 maanden
  • Talen

    Arabisch, Engels, Frans, Spaans
I can make GIS Maps using Different GIS tools, I can develop your R shiny dashboards using your data after cleaning, analyzing and visualizing it

Mijn portfolio

Andere Datavisualisatie diensten die ik aanbied