Door categorieën bladeren
Ontdekken
Fiverr Pro
Nederlands
$
USD


Automatische vertaling
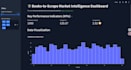
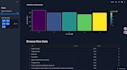
Ben je klaar met statische Excel-rapporten? Laten we je ruwe data (CSV, Excel, Google Sheets) omzetten in een verbluffend, interactief webdashboard.
Ik maak niet alleen grafieken; ik bouw op maat gemaakte webapplicaties met Python, Streamlit en Plotly. Zo kunnen jij en je team filteren, verkennen en inzichten vinden in real-time.
Wat mijn Dashboard Service bevat:
Waarom kiezen voor mij voor jouw dashboard?
Stuur me gerust een bericht VOORDAT je bestelt!
Dashboard projecten zijn zeer maatwerk. Een korte chat van 5 minuten is de beste manier om de scope, prijs te bevestigen en het succes van je project te garanderen.
Python Expert for Data Analysis, Visualization and Automation
Talen
Automatische vertaling
Automatische vertaling
Waarom moet ik eerst contact opnemen voordat ik bestel?
Dashboard projecten zijn zeer maatwerk, geen 'kant-en-klare' producten. Een korte chat van 5 minuten is de enige manier om te zorgen dat we het eens worden over alle functies, de data bronnen en het uiteindelijke ontwerp. Dit voorkomt misverstanden en garandeert dat je de exacte app krijgt die je voor ogen hebt.
Hoe ontvang ik het uiteindelijke dashboard? Heb ik mijn eigen server nodig?
Je hebt geen servers nodig! Ik deploy het uiteindelijke dashboard naar een gratis, veilig en privé (of openbaar) weblink via Streamlit Cloud. Je krijgt een URL die je vanaf elke browser kunt openen, net als mijn portfolio demo. Het is een volledig gehoste oplossing.
Wat houdt een 'revision' in voor een dashboard?
Een revision omvat aanpassingen aan de *overeengekomen* functies (bijvoorbeeld het veranderen van grafiek kleuren, aanpassen van de layout, of tekst corrigeren). Het omvat **niet** het toevoegen van nieuwe pagina's, data bronnen of interactieve functies die niet besproken zijn in onze oorspronkelijke opdracht. Hiervoor is een Gig Extra nodig.
Welk soort data bestand moet ik aanleveren?
Mijn Basic en Standard pakketten gaan uit van één enkele, 'schone' data file (bijvoorbeeld CSV, Excel). Als je data rommelig is, uit meerdere bestanden bestaat, of gescraped moet worden, kies dan voor het Premium pakket of neem eerst contact op. Ik bied ook data schoonmaak als aparte service aan!
Waarom is dit Streamlit dashboard beter dan alleen Excel grafieken?
Een Excel grafiek is een statische afbeelding. Een Streamlit dashboard is een **levend, interactief hulpmiddel**. Je hele team kan een weblink openen, 24/7 filteren en inzichten verkennen in real-time zonder speciale software. Het brengt je data tot leven.


