Door categorieën bladeren
Nederlands
$
USD
Koppel je AI aan Fiverr

Clearer data, smarter reporting, and dashboards built around your business needs
Skills
Bekijk mijn diensten


Data Visualization & Reporting Specialist
BISMATraining • ZZP
Dec 2019 - Nov 2023 • 3 yrs 11 mos
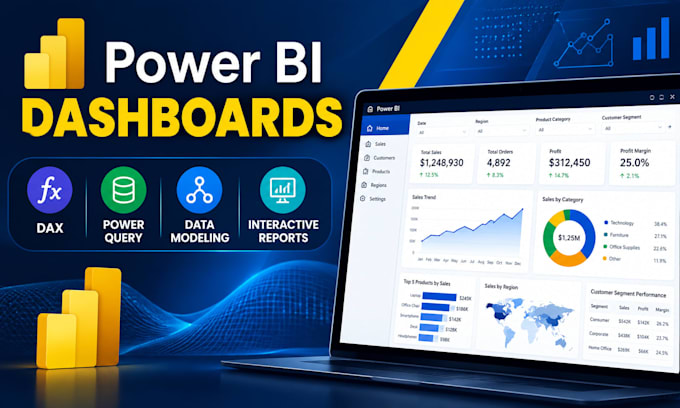
For 6 years, Sara Martin has been helping businesses make better use of the information already sitting inside their spreadsheets and reporting systems. Her work centers on one practical question: can you look at your numbers, understand what is happening, and know what needs attention without digging through multiple files? She builds reporting solutions in Google Sheets, Excel, Power BI, and Tableau for businesses tracking sales, revenue, expenses, operations, inventory, targets, and other performance measures. This can include a dashboard built from an existing dataset, a reporting workbook that needs better structure, an automated spreadsheet that removes repetitive work, or a visual report designed to make important trends easier to spot. Rather than starting with charts, Sara starts with the reporting need. She examines the available data, identifies the figures that matter, establishes the calculations and relationships behind them, and then builds the reporting view around how the information will actually be used. Formulas, filters, data models, KPI logic, layout, and usability all have a role in the final result. She also understands that a useful reporting tool needs to work after delivery. Reports should be understandable, practical to update, and structured well enough for recurring use not simply attractive in a screenshot. With 6 years of hands on experience, Sara brings a detail focused approach to each project and communicates clearly throughout the work. If your current reporting feels scattered, repetitive, difficult to follow, or simply does not answer the questions you need, share what you have and what you need to see. Sara can help turn that starting point into a reporting system that makes the numbers easier to work with.
