Door categorieën bladeren
Ontdekken
Fiverr Pro
Nederlands
$
USD


Automatische vertaling
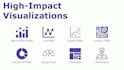
Zet je ruwe data om in high-resolution, krachtige en publicatieklare visualisaties.
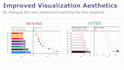
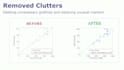
Slecht opgemaakte visualisaties kunnen leiden tot directe afwijzingen door de redactie. Daarom bied ik mijn diensten aan in het ontwerpen van high-resolution, krachtige en nauwkeurige visualisaties die zijn afgestemd op peer-reviewed tijdschrift- en conferentieartikelen, conferentieposters, scripties, theses, boeken, websites of soortgelijke platforms.
Wat ik voor je kan maken:
Tools die ik kan gebruiken:
Wat ik van jou nodig heb:
Jouw opleveringen:
Neem contact met me op voor een prijsopgave voordat je een bestelling plaatst voor zeer complexe visualisaties.
Manuscript Editor and Data Visualizer
Talen
Automatische vertaling
Automatische vertaling
Kun je de volledige workflow schetsen?
Zodra je je data of conceptschetsen samen met je keuzes aanlevert, maak ik een eerste ontwerp dat is afgestemd op jouw wensen voor jouw beoordeling. Daarna voer ik eventuele gevraagde aanpassingen door en lever ik de definitieve high-resolution bestanden aan je op.
Zijn revisies inbegrepen in je workflow?
Ja! Elk pakket bevat een vast aantal revisies. Voor extra wijzigingen buiten dat aantal kun je overwegen een extra revision add-on te kopen.
Hoe zit het met de vertrouwelijkheid van mijn data?
Ik verzeker je dat je data met de grootste vertrouwelijkheid worden behandeld. Zodra het werk klaar is en je bestelling is geleverd, worden alle data permanent en onherroepelijk verwijderd uit mijn systeem.
Kun je specifieke richtlijnen en stijlen volgen voor data visualisatie?
Ja. Stuur me gewoon je ontwerp-richtlijnen en je specifieke stijlvoorkeuren.
Ik weet niet helemaal welke data visualisatie het beste werkt. Kun je me daarbij helpen?
Ja, zeker. Als je je doelen deelt, kan ik de meest effectieve data visualisaties aanbevelen om je werk te verbeteren.
Moet ik jouw werk erkennen als ik van plan ben de figuren op een van de publieke platforms te publiceren?
Bij de uiteindelijke levering van je bestelling word jij de enige eigenaar van de copyright van de bestanden. Je mag ze dus op elke manier gebruiken die je passend vindt. Ik zou het waarderen als je mijn werk erkent, maar dat is geen must.
Bied je ook data cleaning services of statistische analyses aan?
Nee, deze dienst richt zich vooral op data visualisatie. Als je project echter behoefte heeft aan data cleaning of statistische analyses, bespreek dan de details met mij voordat je je bestelling plaatst.
Maak je voor mij onderzoeksresultaten en creëer je daarna visualisaties op basis van die data?
Absoluut niet. Ik werk volgens een strikte toewijding aan professionele integriteit en ethisch redigeren. Ik werk alleen met legitieme onderzoeksdata en doe niet aan, faciliteer geen en keur geen vormen van data fabricage goed.
Wat zijn uw annuleringsvoorwaarden?
Ik kan geen annuleringen accepteren zodra ik ben begonnen met werken aan jouw order(s). Daarom raad ik je aan om mijn dienstbeschrijving en FAQ's goed door te lezen voordat je een definitieve beslissing neemt. Als je twijfels of vragen hebt, is het altijd beter om eerst even te appen.
Wat is uw restitutiebeleid?
Om mijn werkethiek te beschermen, bied ik geen refunds aan na levering, tenzij er een overtuigende reden is (bijvoorbeeld de bestelling was onvolledig of verkeerd uitgevoerd) met overtuigend bewijs.


