#Mijn GitHub https://github.com/Vivivikk/Analysis.git
Ik maak high-end Python dashboards om je bedrijfs- of financiële data te visualiseren. Met Pandas, Matplotlib en Seaborn zet ik rommelige spreadsheets om in rapporten die klaar zijn voor presentatie.
Wat je krijgt:
- BASIS: Essentiële data-inzichten ($25)
- Geautomatiseerd script voor snelle data verwerking.
- Berekening van 3 kernmetrics (bijvoorbeeld Min/Max, Gemiddelden, Rendementen).
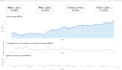
- 2 schone grafieken (Trend en Volume/Distributie).
- Eenvoudige, effectieve visuele lay-out.
- STANDAARD: Professioneel business dashboard ($40)
- Geavanceerd OOP-gebaseerd dashboard (herbruikbare code).
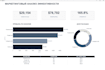
- 5 Premium KPI-kaarten voor high-level metrics (ROI, Winst, etc.).
- 3 complexe visualisaties (Vergelijking, Aandeel en Prestatie).
- Volledige data cleaning en professionele "C-level" ontwerp.
Wat ik van jou nodig heb (Vereisten):
Om te beginnen, stuur alsjeblieft:
- Jouw Data Bestand: CSV of Excel formaat (bijvoorbeeld client_data.xlsx of stocks.csv).
- Heldere Doelen: Noem de specifieke metrics die je wilt volgen (bijvoorbeeld "Ik wil ROI per platform zien" of "Aandelenvolatiliteit").
- Voorkeuren: Eventuele specifieke kleurenschema's of branding vereisten.